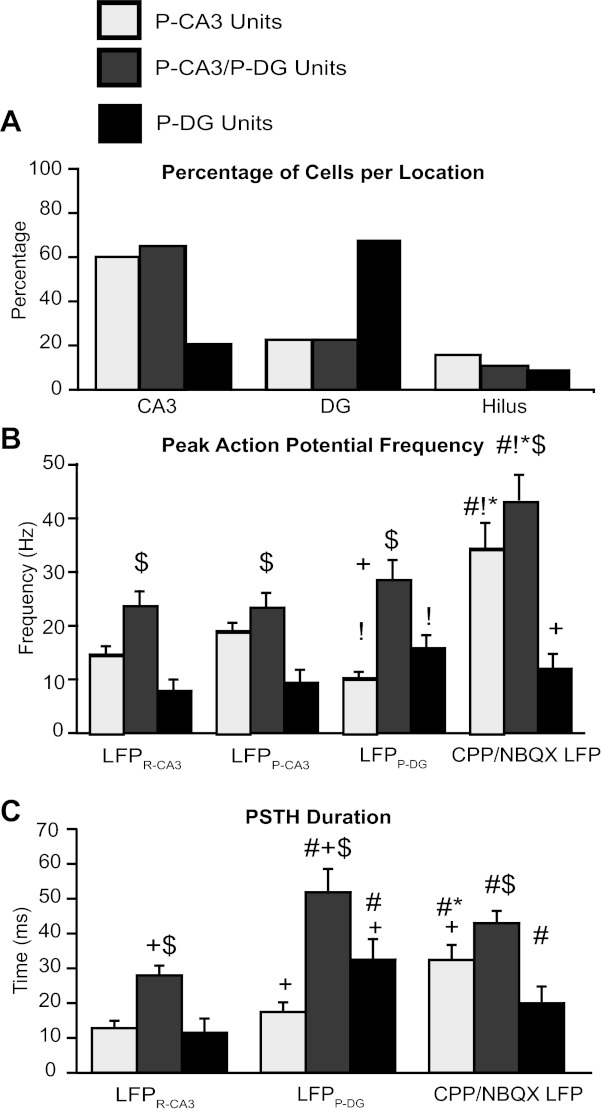
Fig. 4.

Spiking dynamics of P-CA3, P-CA3/P-DG, and P-DG units during epileptiform LFPs. A–C: quantification of P-CA3 units (light shaded bars), P-CA3/P-DG units (dark shaded bars), and P-DG units (solid bars) firing patterns with respect to the different LFPs. Single unit activity was described in terms of the percentage of cells per location (A), peak AP frequency (B), and duration (C). Note that units were not included in the statistical analysis when there was no PSTH response to that particular field. +P < 0.05 vs. CA3-P units; $P < 0.05 vs. DG-P units; #P < 0.05 vs. LFPR-CA3, !P < 0.05 vs. LFPP-CA3; *P < 0.05 vs. LFPP-DG.
