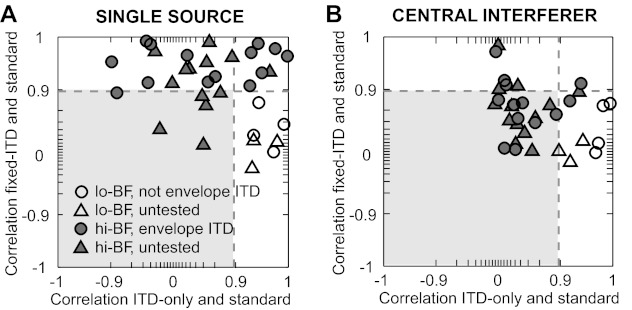
Fig. 10.

Comparison of the shapes of azimuth tuning functions under altered binaural cue conditions. A: for single sources, the correlation of the shapes of the target azimuth tuning functions between fixed-ITD and standard conditions is plotted against the correlation between ITD-only and standard conditions. B: same as in A for target azimuth tuning functions in the presence of a central interferer. Open symbols denote neurons with BF ≤ 1.5 kHz; solid symbols denote neurons with BF ≥ 2.5 kHz. Filled circles indicate envelope ITD sensitivity, open circles indicate no envelope ITD sensitivity, and triangles indicate that ITD tuning data were not collected. Dashed lines indicate r2 = 0.8 (positive r), and the area bounded by r2 < 0.8 for both axes is shaded.
