
Fig. 12.
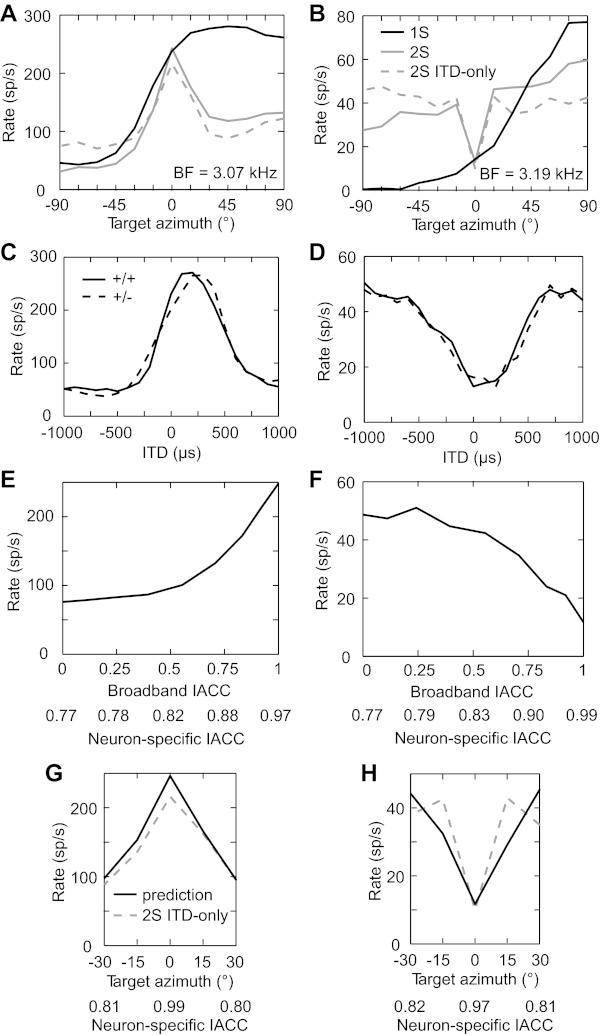
Interaural envelope decorrelation predicts firing rates when a target is separated from a central interferer. A and B: target azimuth tuning functions of 2 IC neurons for single source (black solid line), central interferer (gray solid line), and central interferer in the ITD-only condition (gray dashed line). C and D: ITD tuning functions for the neurons in A and B, respectively. Solid lines indicate the same left/right waveform polarity, and dashed lines indicate reversed polarity. E and F: rate as a function of broadband IACC for the neurons in A and B, respectively. X-axes were alternatively converted into neuron-specific IACC. G and H: rate prediction (black solid line) based on the neuron-specific IACC of the target/interferer stimuli (see methods) and the rate-vs.-neuron-specific IACC function in E and F. Gray dashed line indicates target azimuth tuning function in the presence of a central interferer in the ITD-only condition.