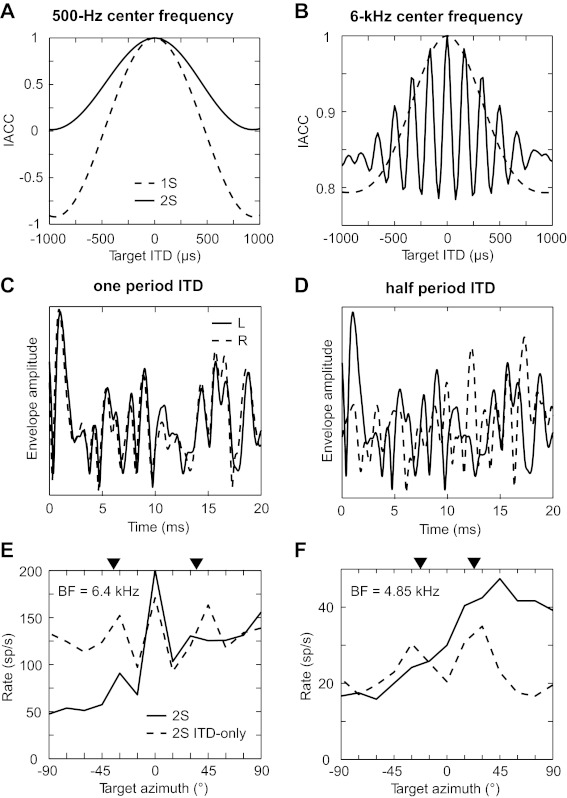
Fig. 13.

Differences in the cross-correlation of whole waveforms and envelopes. Left and right broadband noises were bandpass filtered at center frequencies of 500 Hz (A; 0.6-oct bandwidth) and 6 kHz (B; 0.25-oct bandwidth). The normalized IACC was computed from the whole waveforms (A) and from the envelopes (B) as a function of target ITD. IACC was computed for a single source (dashed line) and in the presence of an interferer at zero ITD (solid line). C: a 20-ms segment of the left (solid line) and right envelopes (dashed line) used to compute the IACC in the presence of an interferer when the target ITD is equal to one period of the center frequency (i.e., at the side peak of the solid curve in B). D: same as in C for a target ITD equal to one-half period of the center frequency (i.e., at the side trough of the solid curve in B). E and F: tuning functions in the presence of a central interferer in the ITD-only condition that oscillate with azimuth for 2 neurons. Dashed lines indicates ITD-only condition, and solid line indicates standard condition. Arrowheads indicate the azimuths corresponding to ITDs of one period (E) and one-half period (F) of the BF away from zero.
