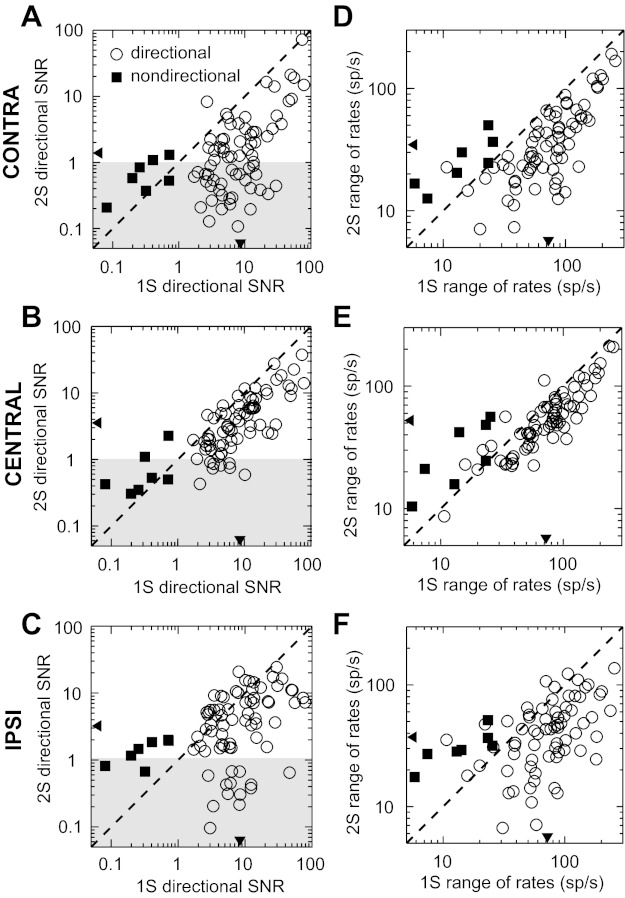
Fig. 5.

Sensitivity to target azimuth in the presence of an interferer. A–C: scatterplot of single-source directional SNR vs. 2-source directional SNR for the contralateral, central, and ipsilateral interferers, respectively. Shaded area indicates a 2-source directional SNR < 1. D–F: scatterplots of the range of mean firing rates in the single-source azimuth tuning function vs. those in the 2-source tuning function with contralateral, central, and ipsilateral interferers, respectively. One outlier with a small 2-source range of rates was omitted from F. Circles indicate directional neurons (n = 71), and squares indicate nondirectional neurons (n = 7). Triangles on the x- and y-axes indicate the geometric means of the data from directional neurons. Dashed lines indicate unity. 1S, single source; 2S, 2-source.
