
Fig. 6.
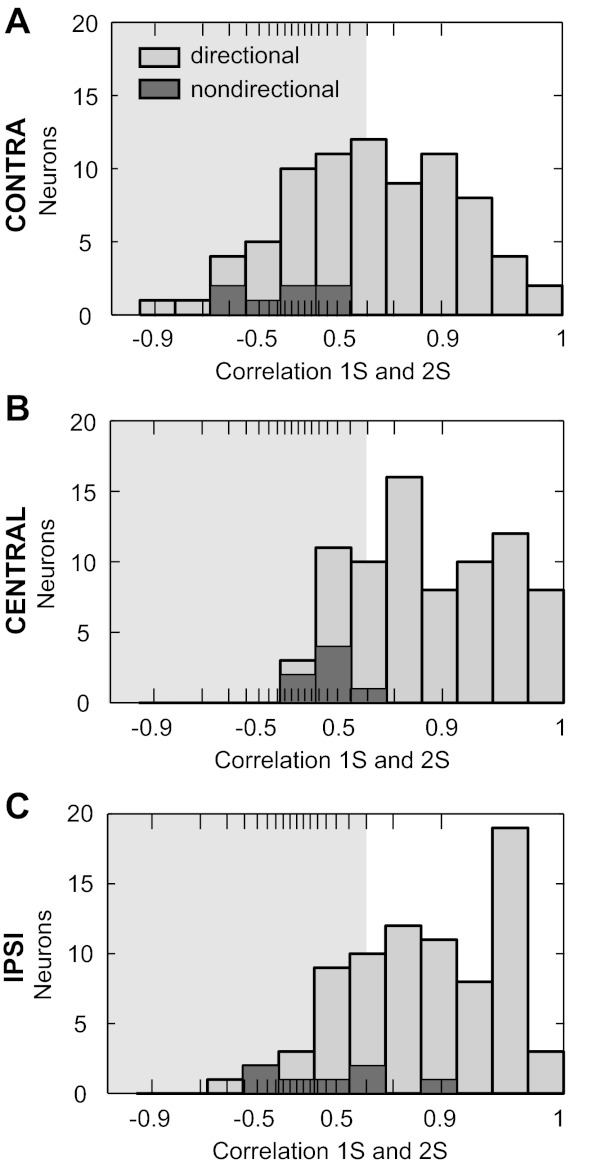
Comparison of the shapes of azimuth tuning functions between single-source and interferer conditions. A–C: histograms of the correlation between the single-source azimuth tuning function and the tuning function in the presence of a contralateral, central, or ipsilateral interferer, respectively. X-axis is tangent-transformed. Shaded area indicates r2 < 0.5.