
Fig. 1.
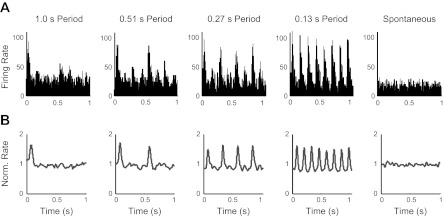
Firing rates in the awake state averaged across stimulus repetitions over ∼1-s intervals. A: firing rate histogram for 1 unit, plotted in 5-ms bins. B: average normalized (Norm.) smoothed firing rate responses (materials and methods) across all awake units (n = 66). Gray lines show the mean of the normalized rate. Peaks are present at regular stimulus-period intervals for all visual conditions, showing unit responses to the visual stimuli.