
Fig. 4.
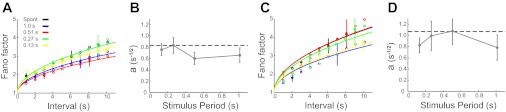
Variability under light anesthesia. Color scheme, fits, and error bars are as in Fig. 3. A and C: average Fano factors in the very light (A) and light (C) anesthetized states for all stimulus conditions and spike-counting intervals with their best fits (curves). B and D: the a values from the fits in A and C, respectively, plotted against the period of the visual stimulus. The black dashed line is the a value for spontaneous activity.