
Fig. 7.
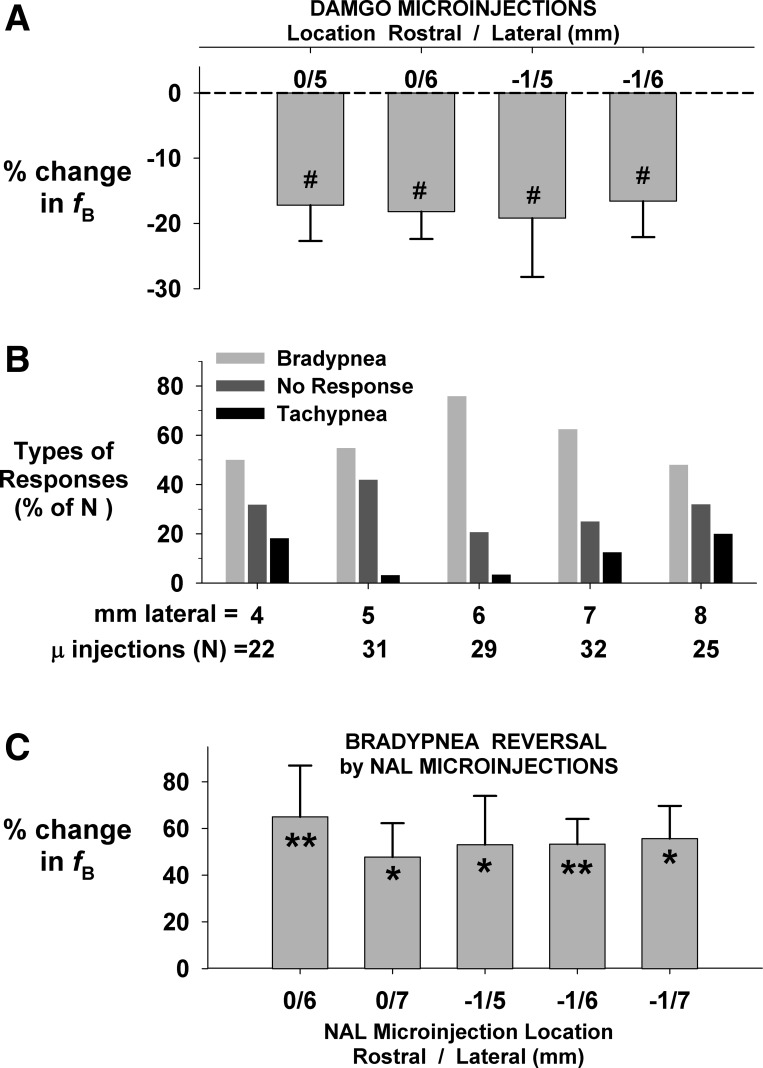
A: % change in fB for each microinjection of 300–500 nl of 100 μM DAMGO at the site indicated above each bar (also in Fig. 6A, open circles; n = 10 dogs). #P < 0.05 difference from zero change (1-way ANOVA). B: types of responses to DAMGO as % of the number (N) of DAMGO microinjections per lateral coordinate (all R-C locations pooled). Tachypnea was rarely observed throughout the mapped region (darkest bars). C: % reversal of the remi-induced depression of fB per NAL microinjection (540 nl of 100 μM NAL). *P < 0.05, **P < 0.01 changes relative to no effect (1-way ANOVA).