
Figure 2. Single neuron and population activity.
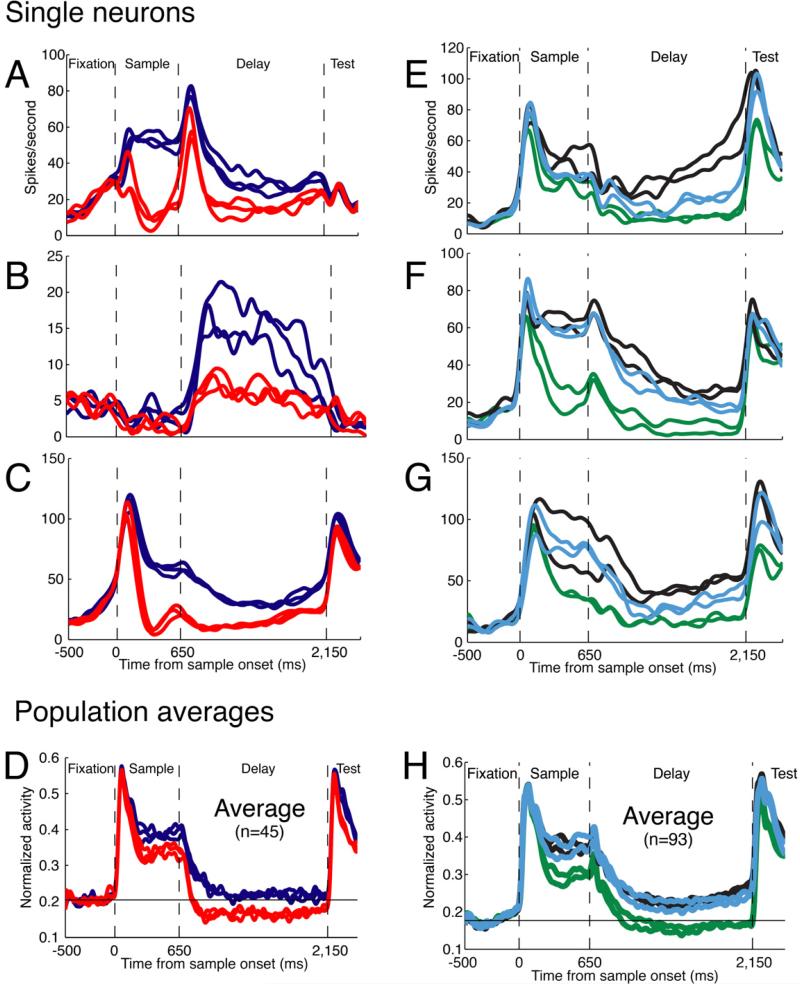
A-C. Three single neurons recorded while Monkey H performed the direction-categorization task. The six traces in each plot correspond to the mean neuronal activity evoked by each of the six directions, and the same colors indicate directions that belong to the same category.
D. The mean normalized activity recorded from the population of 45 neurons. The normalized spontaneous activity is indicated by the black horizontal line.
E-G. Three single neurons recorded while Monkey H performed the shape pair-association task. The six traces in each plot correspond to the mean neuronal activity evoked by each of the six sample shapes, and the same colors indicate associated shapes.
H. The mean normalized activity from the population of 93 recorded neurons. The normalized spontaneous activity is indicated by the black horizontal line.