
Figure 7. Relationship between the spontaneous activity and the activity during the direction categorization task.
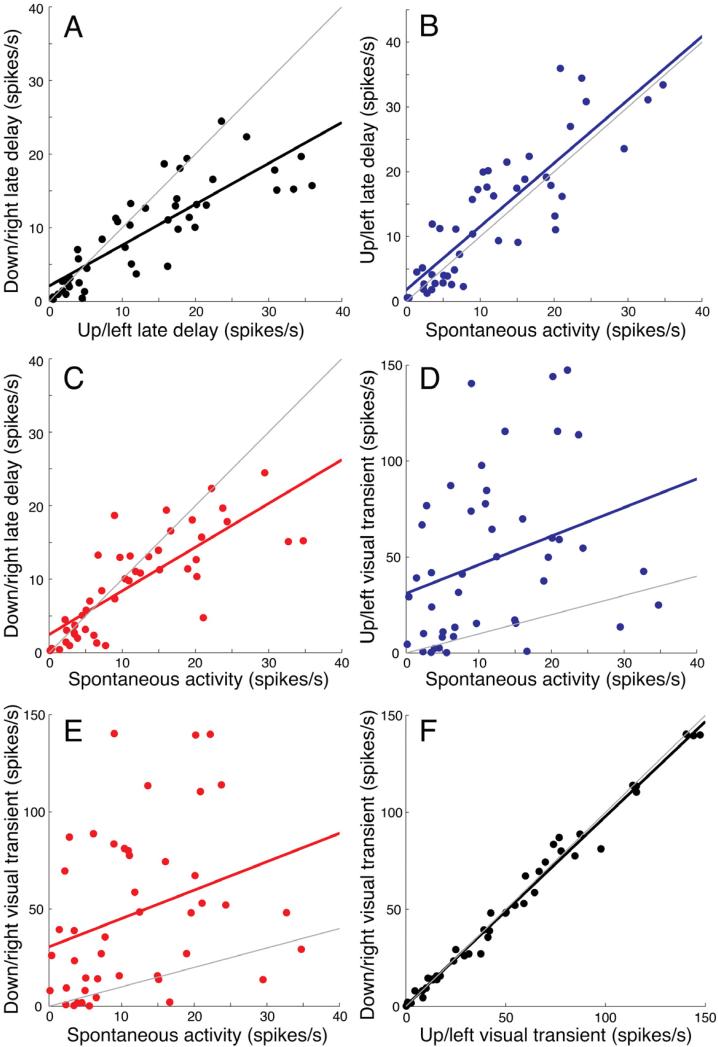
A. The averaged late delay activity (750-1500 ms following motion offset) of the two categories recorded from Monkey H during the six-direction categorization task are plotted against each other. Linear regression: r = 0.70, P < 10-12. The gray line has a slope of 1.
B-C. The activity during the late delay versus the spontaneous activity recorded during the fixation period (50-450 ms following fixation). Each point represents the mean activity of an individual neuron during the presentation of one direction category. Linear regressions are fitted separately for each category: up/left category (B, blue points): r = 0.73, P < 10-12; down/right category (C, red points): r = 0.62, P < 10-9.
D-E. The activity during the early visual transient (40-140 ms following motion onset) versus spontaneous activity, plotted in the same convention as above. Linear regressions are fitted separately for each category: up/left category (D, blue points): r = 0.099, P = 0.036; down/right category (E, red points): r = 0.098, P = 0.036.
F. The averaged early visual transient (40-140 ms following motion onset) of the two categories plotted against each other. Linear regression: r = 0.99, P ~ 0. The gray line has a slope of 1.