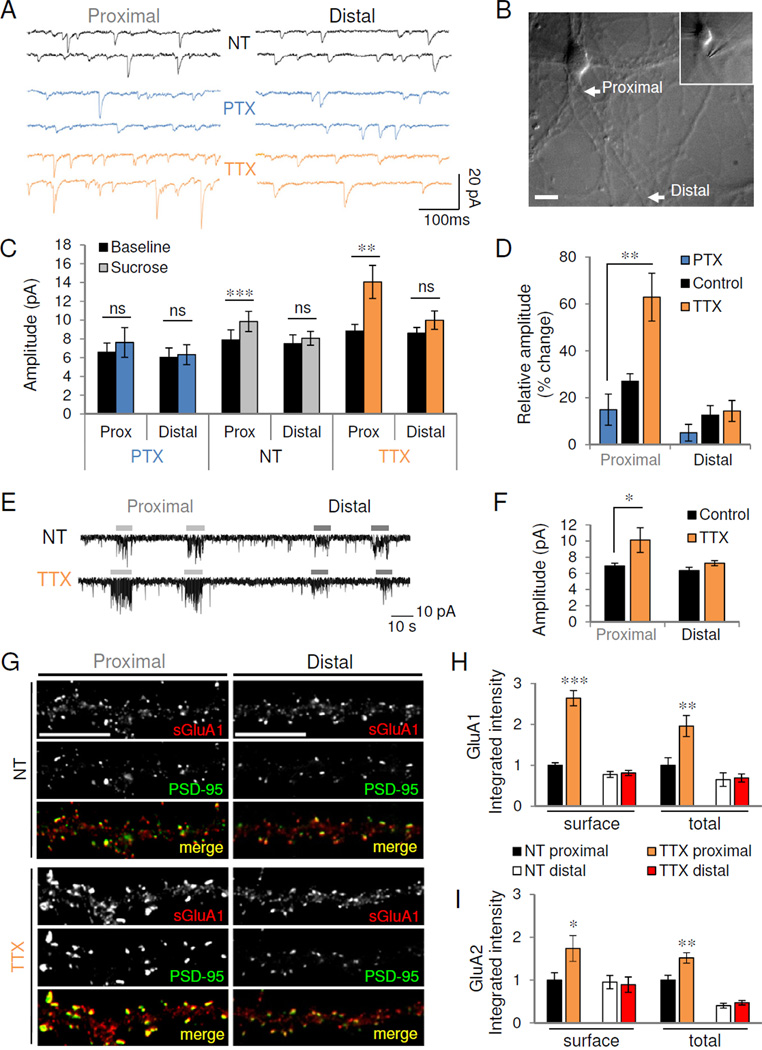
Figure 2. HSP selectively regulates proximal synaptic efficacy and AMPAR accumulation.

(A) Representative 500ms traces of mEPSCs recorded during proximal (left) and distal (right) stimulation of control (NT) or activity-modulated neurons. (B) DIC image of neuron stimulated focally at proximal (~15 µm from soma, see inset) and distal (~120 µm) dendritic locations. Scale, 20 µm. (C) Average mEPSC amplitude recorded before (baseline) or after (sucrose) stimulation of proximal and distal synapses for conditions indicated (n=11 NT neurons, 12 TTX, 5 PTX); ns, not significant; **P=0.0048, ***P=5.91×10⁻⁶. (D) Percent change in mEPSC amplitude over baseline during proximal and distal stimulation. **P=0.009. (E) Miniature EPSCs recorded from a control (top) and TTX-treated (bottom) neuron during kynurenic acid blockade. Bars indicate sucrose stimulation of proximal and distal dendrites. (F) Mean mEPSC amplitude evoked during kynurenic acid blockade (n=4 NT, 5 TTX). *P=0.027. (G) Immunostaining for surface GluA1 (sGluA1, red) and PSD-95 (green) in proximal (left) and distal (right) dendrites of control (NT) or TTX-treated neurons. Scale, 10 µm. (H–I) Quantification of normalized GluA1 (H) and GluA2 (I) immunoreactivity in proximal and distal dendrites (n=11–13). *P<0.05, **P<0.01, ***P<0.001. For distal dendrites, t-test vs. NT: surface GluA1, P=0.71; total GluA1, P=0.83; surface GluA2, P=0.81; total GluA2, P=0.38. Data are means±SEM. See also Figure S2.
