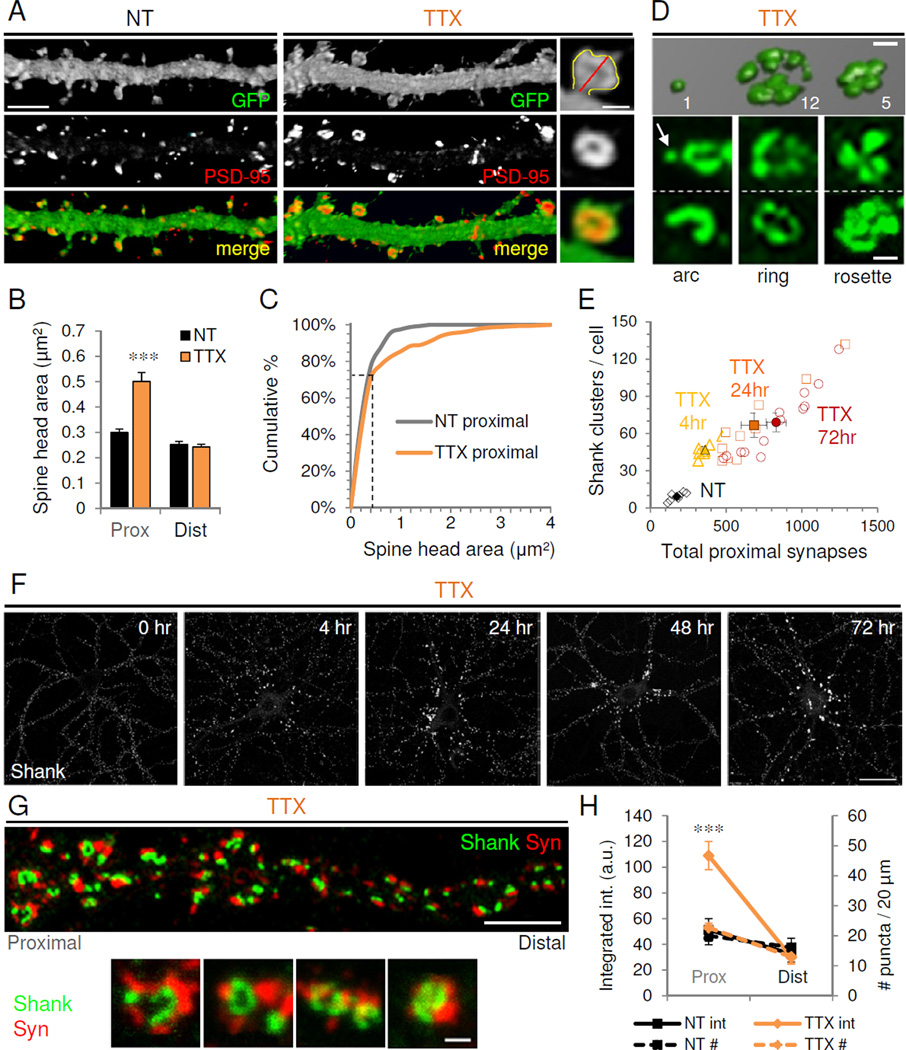
Figure 4. Inactivity induces proximal giant cluster synapses.

(A) Confocal images of proximal dendrites from GFP-expressing nontreated (NT) and TTX-treated cultured hippocampal neurons (21 DIV) immunostained against GFP fill (green) and PSD-95 (red). Right, higher magnification view of a giant spine showing method for quantifying spine head area (yellow line) and spine length (red). Scales, 5 µm for dendrites, 1 µm for inset. (B) Average spine head area in proximal and distal dendrites of control (NT) and TTX-treated neurons. ***P<0.001 (n=8). Data are means±SEM. (C) Cumulative distribution of spine head areas in proximal dendrites of control and TTX-treated neurons; ***P<0.005, K-S test (NT=322 vs. TTX=337 spines). Note the non-multiplicative shift occurring preferentially in the larger spine population (indicated with dotted lines). (D) 3D confocal microscopy reconstruction of Shank immunostaining from a TTX-treated neuron showing a simple synapse (left) and neighboring giant cluster synapses. Values indicate number of PSD lobes per cluster (see Methods for calculation). Below, common arrangements of clusters (arrow indicates simple synapse). Scale, 1 µm. (E) Correlation between total number of excitatory synapses in proximal dendrites and number of clusters for control (NT) and TTX-treated neurons at 4, 24, and 72 hr. Open symbols, individual neurons; filled symbols, mean population values±SEM. (F) Timecourse of Shank immunostaining in TTX-treated neurons. Scale, 20 µm. (G) TTX-treated neuron immunostained for presynaptic synaptophysin (Syn, red) and postsynaptic Shank (green). Scale, 5 µm. Below, high magnification views of Shank and Syn giant clusters. Scale, 1 µm. (H) Syn integrated intensity (solid lines) and number of Syn puncta (dotted lines) in proximal and distal dendrites of NT or TTX neurons; ***P<0.001, t-test vs. NT. See also Figure S4.
