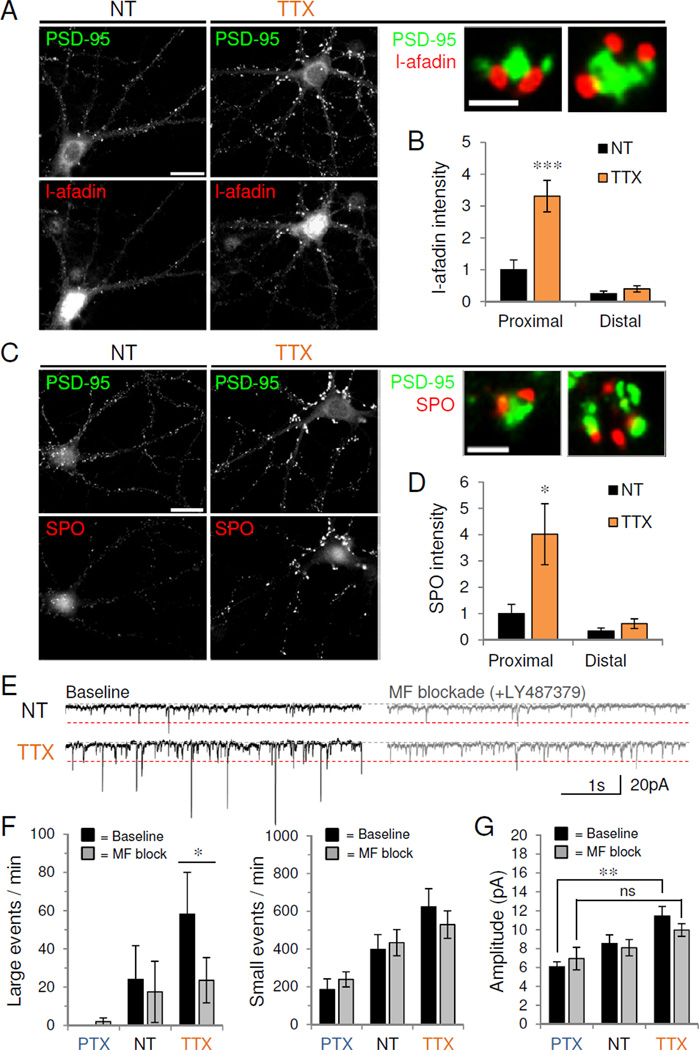
Figure 5. Inactivity promotes mossy fiber-TE synapse upregulation.

(A,C) Control (NT) or TTX-treated CA3 neurons (DIV 24) stained for endogenous PSD-95 (green) with either (A) TE puncta adherentia protein, l-afadin (red) or (C) presynaptic mossy fiber protein, synaptoporin (SPO, red). Scale, 20 µm. High magnification views show two representative proximal cluster synapses with merged co-staining. Scale, 1 µm. (B,D) Quantification of immunoreactivity for (B) l-afadin or (D) SPO in control or TTX-treated proximal and distal dendrites (n=10–11). *P<0.05, ***P<0.001. (E) Representative 5s voltage-clamp traces of mEPSCs recorded from control (NT) or TTX-treated neurons before (left) and after (right) acute mossy fiber blockade with LY487379. Red dotted line, 20 pA cutoff for small vs. large events. (F) Average number of large (>20 pA, left) and small amplitude (<20 pA, right) events per minute recorded from control or activity-modulated neurons before and after LY487379 (n=8). *P=0.032. (G) Average mEPSC amplitude before and after LY487379 application; ns, P=0.08; **P<0.01 (n=5–9). Data are means±SD. See also Figure S5.
