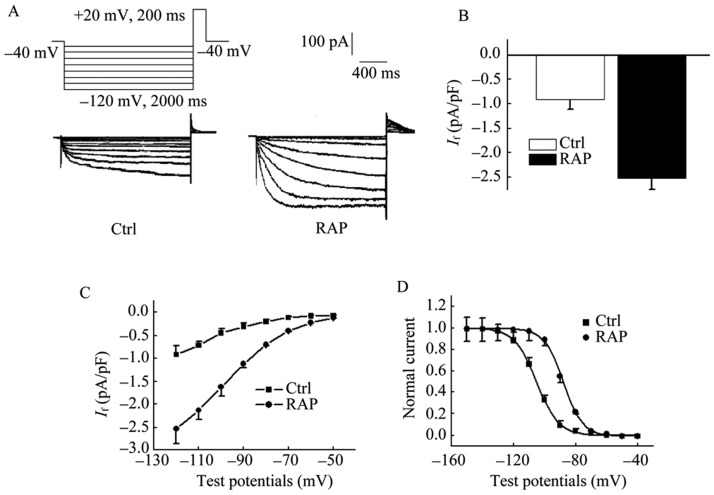
Figure 3. If current characteristics of PVs cardiac myocytes.

(A): If current densities were significantly higher in RAP than in control cells at potentials –120 Mv; (B): RAP: –2.66 ± 0.4 pA/pF vs. Ctrl: –0.91 ± 0.2 pA/pF, P < 0.01, n = 10; (C): the current–voltage relationships of the mean If for RAP and control cells; (D) the steady-state activation curve showed that V1/2 was changed from –105.5 ± 5.2 mV in control cells to –87.3 ± 4.9 mV in RAP group and k was changed from 9.5 ± 1.8 mV to 11.1 ± 2.6 mV. The presence of If was determined in cells by application of hyperpolarizing voltage steps from –50 to –120 mV in 10 mV increments of 2000 ms duration at the holding potential of –40 mV, and then depolarized to +20 mV for 200 ms to elicit tail current. Current traces obtained in representative cells from Control and RAP. PVs: pulmonary vein sleeves; RAP: rapid atrial pacing.
