
Figure 2.
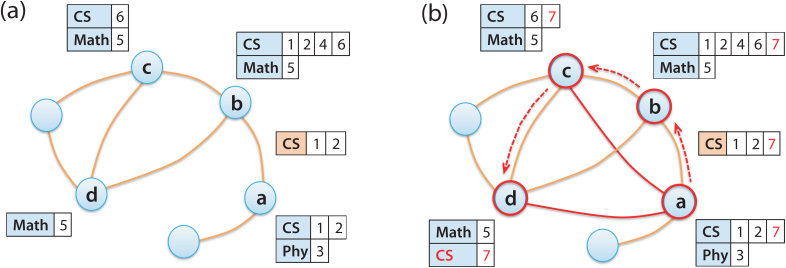
(a) Illustration of the social network structure. Nodes and edges represent scholars and their collaborations. They are annotated with lists of (co)authored papers grouped by scientific fields. For example, scholar b has five papers including four in computer science (CS) and one in Math. Papers 1 and 2 are coauthored with a, papers 5 and 6 with c, and paper 5 with d. Paper 4 is authored by b alone. (b) Illustration of the random walk mechanism to select authors. For the new paper 7, the first author a is chosen randomly and then walks to b and c, stopping at d. These four authors become connected to each other if they have not collaborated before; for example, new edges connect a to c and d. Paper 7 acquires topics CS, Math and Physics (Phy). The main (majority) field of the paper, CS, diffuses across the collaborators, including d who joins this discipline as a result.