
Figure 4. Stylized facts characterizing relationships between scholars, papers, and disciplines.
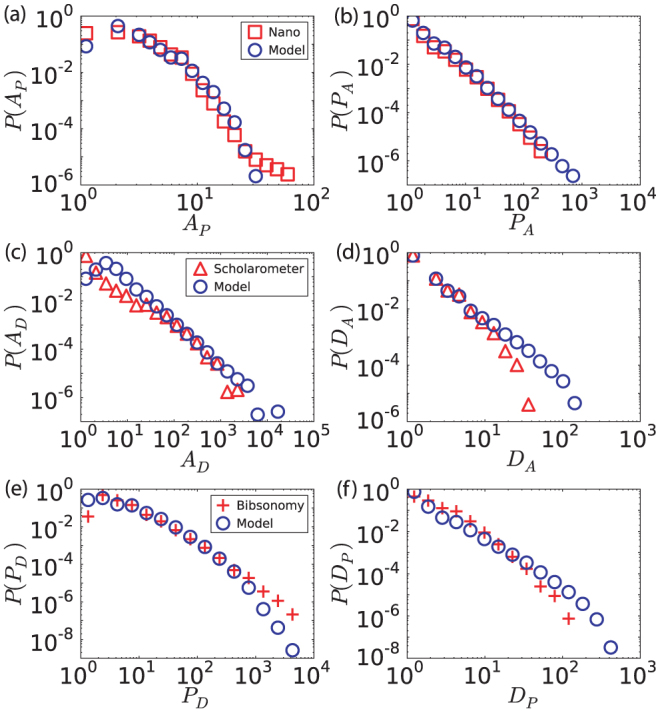
We plot the distributions of (a) authors per paper, (b) papers per scholar, (c) scholars per discipline, (d) disciplines per scholar, (e) papers per discipline, and (f) disciplines per paper. Circles represent the SDS predictions, while other symbols represent the empirical data from the three datasets. The results of the model are averaged over 10 runs.