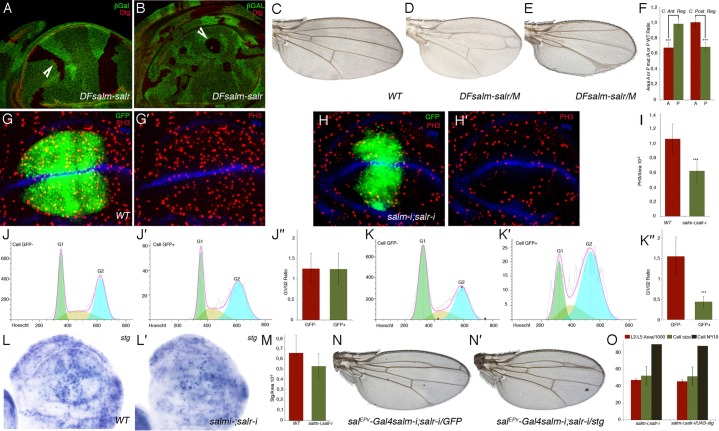
Fig. 3. Requirements of sal genes for cell proliferation and cell cycle progression.

(A,B) Overall appearance of sal mutant clones and their twin spots in lateral regions of the disc (arrowhead in A) and in the central region of the disc (arrowhead in B). Clones are labelled by the absence of βGal (in green) and the expression of Dlg, localized in the apical part of the cells, is in red. (C–E) Wild type wing (C) and mosaic wings bearing large salm/salr M+ clones in the anterior (D) and posterior compartments (E). (F) Quantification of size reductions in mosaic wings. Bars represent mean size ± SEM of the anterior (red bars) and posterior (green bars) compartments. Wings with clones in the anterior compartment are represented in the two left columns, and wings with posterior clones in the two right columns. (G,G′) Expression of PH3 (red) in UAS-dicer2/+; salEPv-Gal4 UAS-GFP/+ control disc with the domain of Sal expression labelled by GFP (green). The expression of Wingless is in blue. (H,H′) Expression of PH3 (red) in UAS-dicer2/+; salEPv-Gal4 UAS-GFP/UAS-salm-i; UAS-salr-i/+. The domain of salEPv-Gal4 expression is labelled by GFP (green) and the expression of Wingless is in blue. (I) Mitotic index of control (left column) and UAS-dicer2/+; salEPv-Gal4 UAS-GFP/UAS-salm-i; UAS-salr-i/+ (right column) discs. (J–J″) Cell cycle profiles of imaginal cells located outside the salEPv-Gal4 domain of expression (GFP negative cells, J) and cells located in this domain (labelled by GFP, J′). The average G1/G2 fractions of five independent experiments is shown in J″. Left column GFP negative cells and right column GFP cells. Imaginal discs were of UAS-dicer2/+; salEPv-Gal4 UAS-GFP/+ genotype. (K–K″) Cell cycle profiles of sal mutant imaginal cells located outside the salEPv-Gal4 domain of expression (GFP negative cells, K) and cells located in this domain (labelled by GFP, K′). The average G1/G2 fractions of five independent experiments is shown in K″. Left column GFP negative cells and right column GFP cells. Imaginal discs were of UAS-dicer2/+; salEPv-Gal4 UAS-GFP/UAS-salm-i; UAS-salr-i/+ genotype. (***) in F,H,K″ represents a p-value<0.005. (L,L′) In situ hybridization of stg RNA probes in wild type (L) and UAS-dicer2/+; salEPv-Gal4 UAS-GFP/UAS-salm-i; UAS-salr-i/+ (L′) third instar discs. Note the reduction in stg RNA in discs where Sal expression is reduced. (M) Quantification of ratio of stg-expressing cells relative to the area of the wing blade in control (left column; 17 wing discs) and UAS-dicer2/+; salEPv-Gal4 UAS-GFP/UAS-salm-i; UAS-salr-i/+ (right column; 22 wing discs) discs. The average ratio is a 15% reduced in UAS-dicer2/+; salEPv-Gal4 UAS-GFP/UAS-salm-i; UAS-salr-i/+ disc, but the dispersion of the mean is very high. (N,N′) Wings of genotype salEPv-Gal4 UAS-salm-i/+; UAS-salr-i/UAS-GFP. (N) and salEPv-Gal4 UAS-salm-i/+; UAS-salr-i/UAS-stg (N′). (O) Quantification of L2–L5 area/1000 (red columns), cell size (green columns) and cell number/10 (grey columns) in salEPv-Gal4 UAS-salm-i/+; UAS-salr-i/UAS-GFP (left columns) and salEPv-Gal4 UAS-salm-i/+; UAS-salr-i/UAS-stg (right columns) wings. Bars represent mean ± SEM in red and green columns, and the cell number.
