
Fig. 3. Co-localization of GFP-dFMRP mutants with poly(A)+ mRNA within dFMRP granules in Schneider.
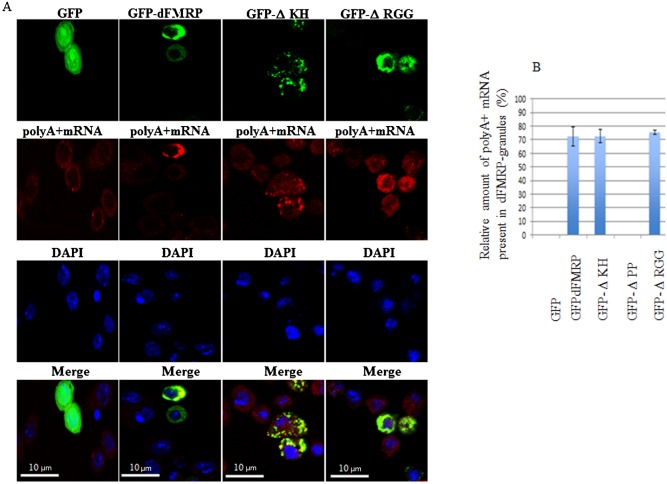
Following transfection with the indicated GFP polypeptides, cells were fixed, permeabilized, and then incubated with 0.2 µM of an Alexa Fluor 594-labeled oligo(dT) probe to detect poly(A)+ mRNA (red), as described in Materials and Methods. (A) dFMRP granules were visualized by confocal microscopy using anti-dFMRP antibodies (green). Scale bar: 10 µm. (B) Densitometry of FISH poly(A)+ mRNA signal with Adobe Photoshop software. The number of pixels and mean intensity were recorded for the selected regions (SG, cytoplasm and background). The mean intensity was multiplied by the number of pixels for the region selected in order to obtain the absolute intensity. The absolute intensity of the background region was subtracted from each region of interest. In order to compare the intensity of two given regions of interest, relative intensities were next calculated. The relative intensity corresponds to the absolute intensity normalized to the absolute intensity of the region of reference.