
Figure 3. Robust Shifts in Gut Microbiota Composition After HF/HS Feeding.
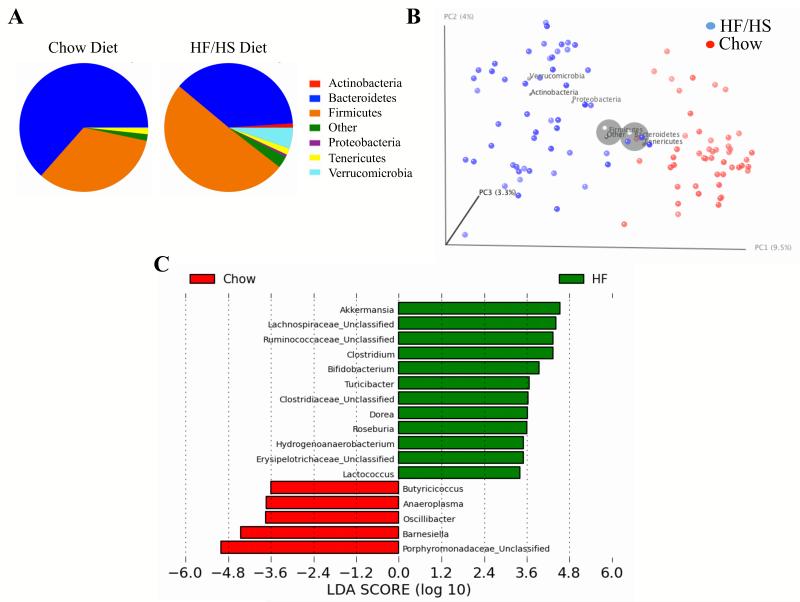
(A) Relative abundances of the different phyla after chow diet and HF/HS feeding (average among 52 matched strains).
(B) Principal Coordinates Analysis (PCoA) plot of the unweighted UniFrac distances. Each circle representing a different mice strain is colored according to the dietary conditions. PC1, PC2 and PC3 values for each mouse sample are plotted; percent variation explained by each PC is shown in parentheses.
(C) Linear Discriminant Analysis (LDA) coupled with effect size measurements identifies the most differentially abundant taxons between chow and HF/HS diets. HF/HS diet enriched taxa are indicated with a positive LDA score (green), and taxa enriched in normal chow diet have a negative score (red). Only taxa meeting an LDA significant threshold >2 are shown.