Figure 2.

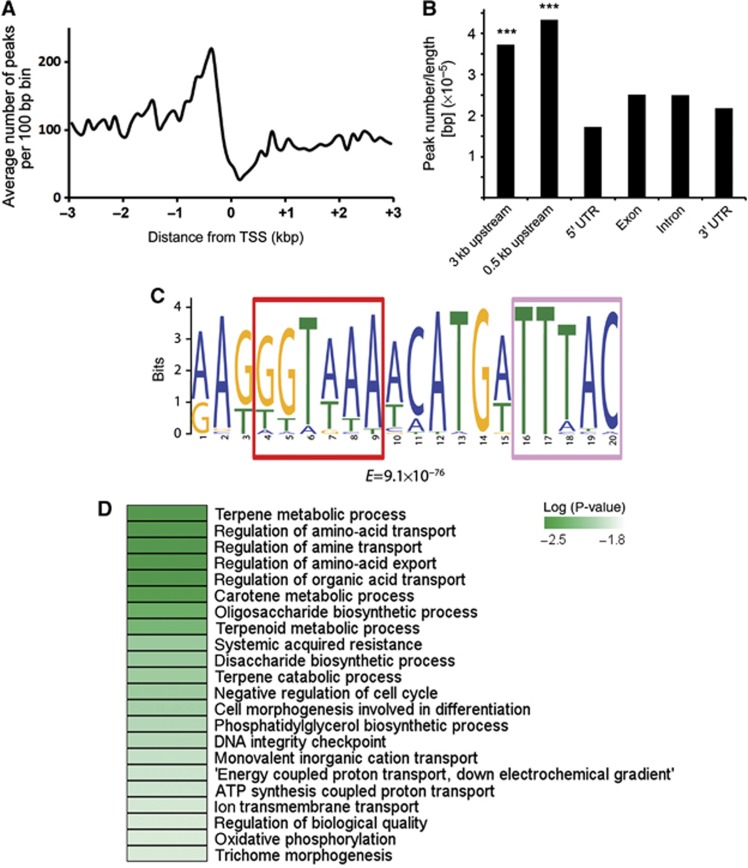
Genome-wide identification of chromatin regions bound by GTL1. (A) Distribution of GTL1 binding within the ±3 kb region of the TSS. (B) Peak distribution of GTL1 binding to the structural elements of genes. Peak centres of individual GTL1-binding sites were used to score the distribution. The peak number was normalised by the length of the entire genome for the category of gene structure. ***P<10−5. The P-value was calculated based on the empirical null distribution with the numbers of 1000 permutations of randomly chosen from GTL1-binding peaks. (C) Putative GTL1 targets share a common DNA-binding motif that contains a GT3-box (5′-GGTAAA-3′) marked with red frame and a palindromic partial GT3 element (5′-TTTAC-3′) marked with light red frame. (D) Representation of the most enriched gene ontology (GO) categories among the putative GTL1 targets identified by ChIP-chip.
