Figure 4.

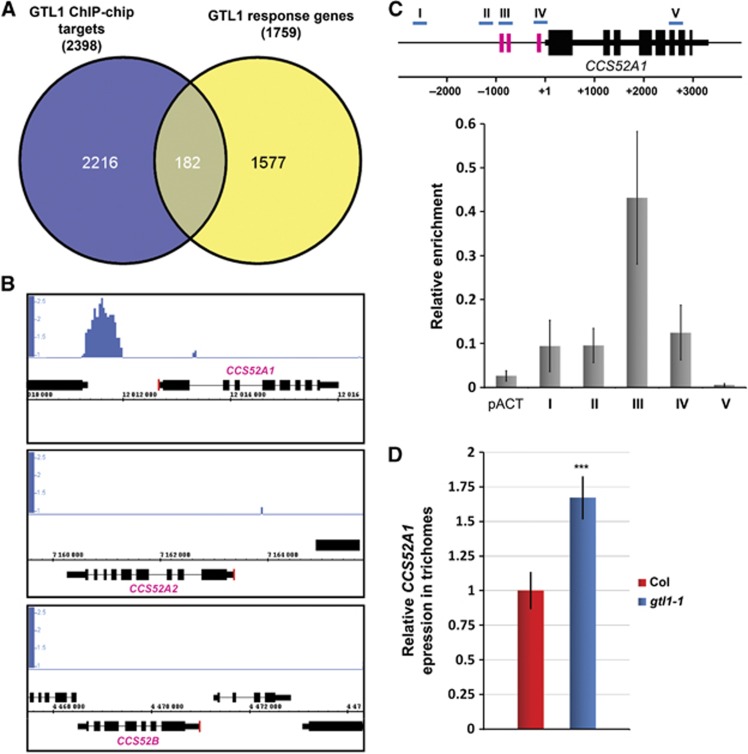
GTL1 directly binds to the promoter of the CCS52A1 gene and represses its transcription. (A) Venn diagram analysis identifies 182 genes as a potential target of GTL1. (B) The IGB analysis of the CCS52A1, CCS52A2 and CCS52B loci shows a clear signal enrichment in the 5′-region upstream of the CCS52A1 open reading frame. Red lines mark the TSS. (C) (Upper panel) Schematic representation of the CCS52A1 locus highlighting the position of GT3 boxes (pink) and primer sets used for ChIP-qPCR (I–V, blue). (Lower panel) ChIP-qPCR analysis reveals the strongest association of GTL1–GFP fusion proteins in the −850 bp region of the 5′UTR. The IP experiments were repeated three times with independent plant samples and the average enrichment of qPCR products from immunoprecipitated DNA is normalised against the corresponding input DNA. pACT shows signal enrichment in the promoter of actin (At3g18780) and error bars represent ±s.d. of the means (n=3). (D) Relative expression of CCS52A1 in trichomes of fifth and sixth leaves from 17-day-old Col and gtl1-1 plants. Errors represent ±s.d. of the means (n=3). Asterisks indicate a significant difference between Col and gtl1-1 (Student’s t-test, P<0.009).
