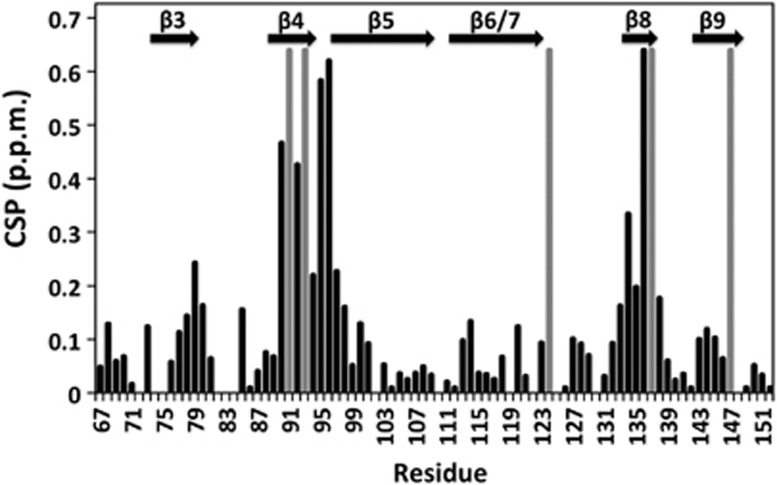
Figure 3.

Histogram of calculated CSPs (black) for the αB-ACD in the presence of saturating concentrations of αB-IxI peptide. Positions where CSPs could not be determined due to exchange behaviour (and therefore have very large chemical shifts) are indicated in grey. Secondary structure elements are shown above.
