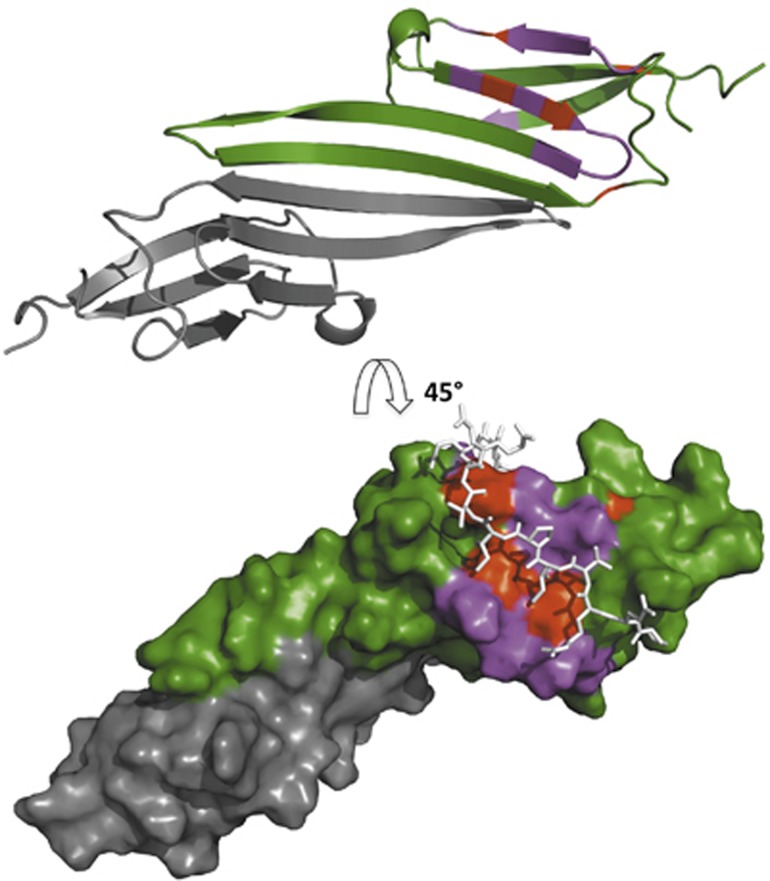
Figure 4.

The chemical shift perturbations due to αB-IxI peptide binding map to the β4/β8 groove on the edge of the ACD. (Top) CSPs are mapped onto a secondary structure representation of the αB-ACD dimer (green and grey) (2klr). The most affected peaks (CSP>0.16) are shown in magenta on one monomer (green) and map to the β4/β8 groove and β4/5 loop. Residues where CSPs could not be quantitated due to exchange over large chemical shifts are shown in red. (Bottom) Surface representation of the αB-ACD dimer (2klr) rotated 45° with the same residue colouring as above. The C-terminal αB sequence PERTIPITREEK (white sticks) is shown as modelled previously with ssNMR restraints to illustrate the congruence between the chemical shifts observed for binding outside the oligomeric context and the structure observed in the context of αB oligomer.
