
Figure 6.
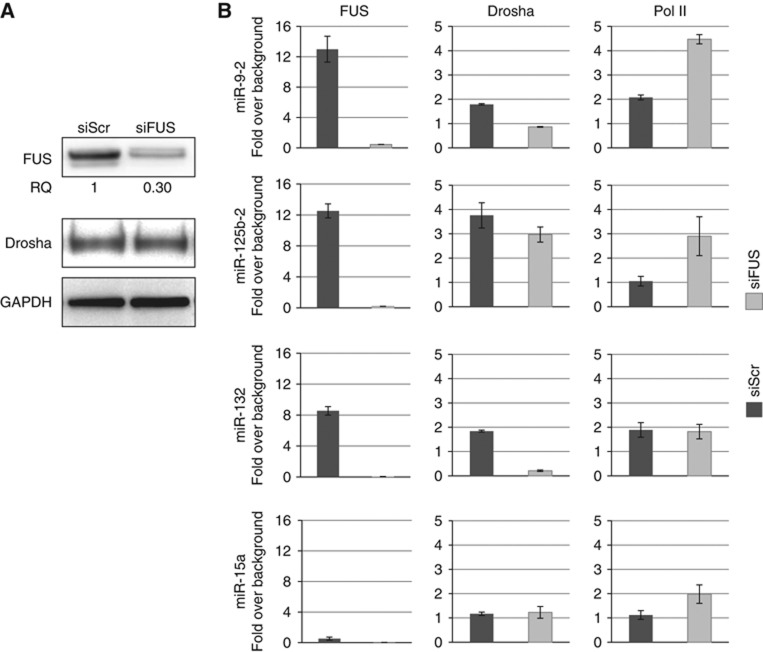
FUS affects co-transcriptional Drosha recruitment. SK-N-BE cells were treated with anti-FUS siRNA (siFUS) or with control siRNA (siScr) and maintained in retinoic acid (RA) for 6 days. (A) Western blot analysis of FUS, Drosha and GAPDH. (B) Histograms showing the results of ChIP analyses with antibodies against FUS, Drosha and Pol II. Chromosomal regions coding for miR-9-2, miR-125b-2, miR-132 and miR-15a were analysed. Co-amplifications were carried out with miRNA- and chromosome IV intergenic region-specific primers. The histograms show the IP values on miRNA loci normalized for the intergenic region and expressed as enrichment over background signals (IgG). Error bars represent s.e.m. from three independent experiments. Source data for this figure is available on the online supplementary information page.