
Figure 2.
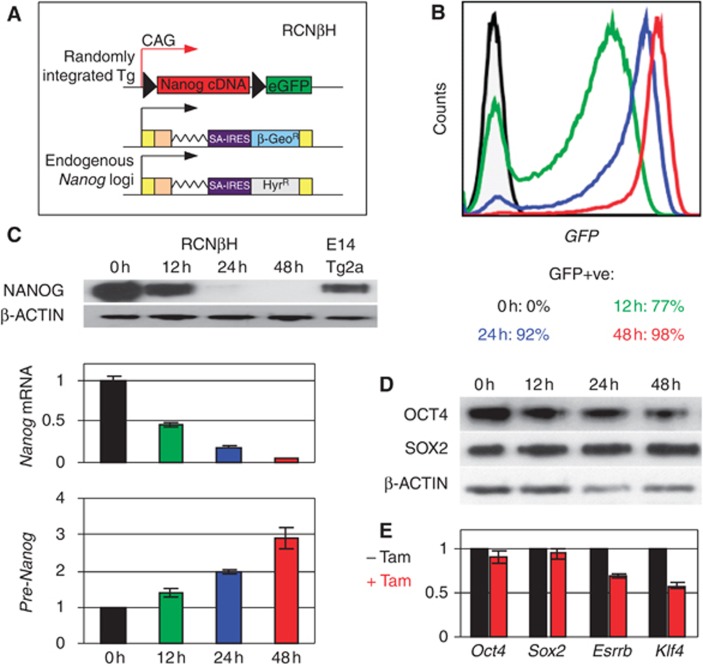
Endogenous Nanog transcription is rapidly upregulated upon loss of exogenous NANOG expression. (A) Schematic diagram of Tamoxifen-inducible Nanog-null ES cells. In addition to the different features shown, RCNβH ES cells carry a Cre-ERT2 transgene knocked-in to Rosa26. (B) FACS profiles monitoring the deletion of the Nanog cDNA transgene after 12, 24 and 48 h of Tamoxifen treatment. (C) Analysis of NANOG protein (top), Nanog mRNA (middle), and Nanog pre-mRNA expression (bottom) in RCNβH cells treated with Tamoxifen for 0 (set to 1 for the RT–(Q)PCR), 12, 24 and 48 h (n=2; error bars represent s.e.m.). (D) Western blot analysis of OCT4 and SOX2 at the same time points of Tamoxifen treatment. (E) Relative expression of Oct4, Sox2, Esrrb and Klf4 transcripts after 48 h of Tamoxifen treatment (untreated cells set to 1; n=7; error bars represent s.e.m.).