
Figure 5.
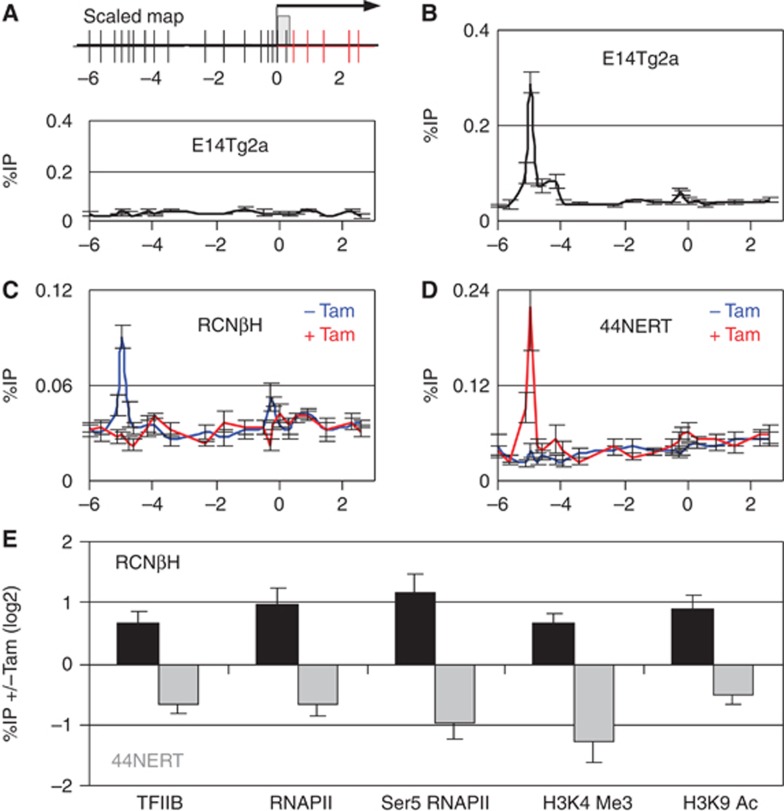
Transcriptional foundation of Nanog autorepression. (A) (Top) Schematic representation of the 5′ end of the Nanog locus analysed by ChIP. Each vertical bar represents a primer pair. The five primer pairs coloured in red are located within Nanog intron 1 and were used to detect pre-mRNA transcription from the endogenous locus (also represented in Figure 1B). The arrow represents the transcription start site (TSS) of Nanog, and the grey box Nanog exon 1. (Bottom) ChIP profile obtained in E14Tg2a using an irrelevant IgG as a negative control (n=2). (B–D) ChIP analysis of NANOG across the Nanog 5′ region in the indicated lines and conditions (B, E14Tg2a, n=4; C, RCNβH, n=6; D, 44NERT, n=6). (E) Tamoxifen-induced changes in binding of the indicated factors at the Nanog promoter as determined by ChIP in RCNβH (48 h of Tamoxifen treatment) and 44NERT (24 h of Tamoxifen treatment). Error bars represent s.e.m.