
Figure 9.
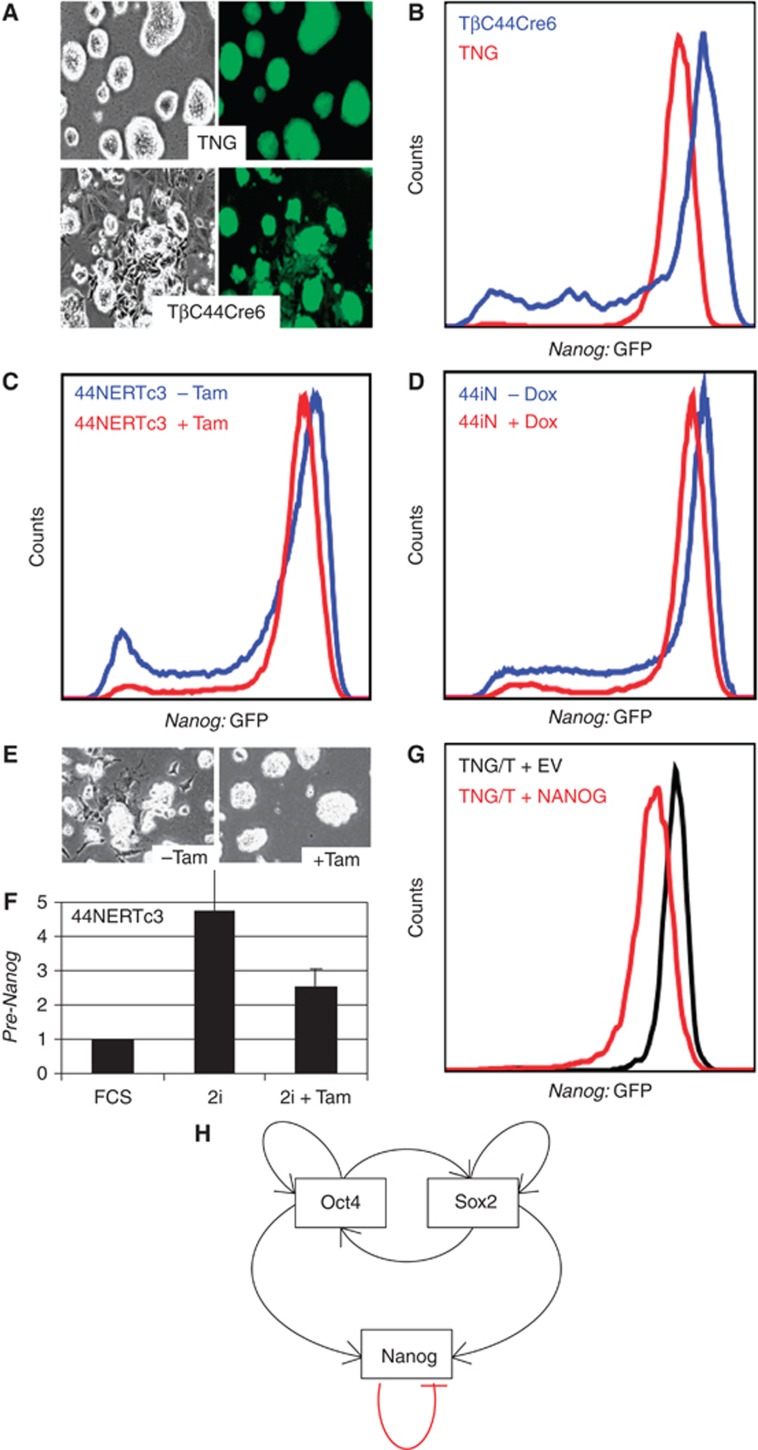
NANOG-mediated repression of Nanog is operational in ‘2i+LIF’. (A) Representative pictures of TNG and TβC44Cre6 cells cultured in serum-free ‘2i+LIF’ medium. Note the extensive differentiation observed in Nanog-null TβC44Cre6. (B) FACS analysis of TNG and TβC44Cre6 cells cultured in serum-free ‘2i+LIF’ medium. (C) FACS analysis of 44NERTc3 cells cultured in serum-free ‘2i+LIF’ medium in the presence or absence of Tamoxifen. (D) Identical analysis of 44iN cells cultured in the presence or absence of Doxycycline. (E) Representative pictures of 44NERTc3 cells cultured in ‘2i+LIF’ in the presence/absence of Tamoxifen. (F) Expression of Nanog locus derived pre-mRNA from 44NERTc3 cells grown in parallel in serum (FCS, set to 1), in ‘2i+LIF’ or in ‘2i+LIF’ supplemented with Tamoxifen for 24 h (n=2 for each condition, error bars represent s.e.m.). (G) FACS analysis of TNG/T cells cultured in ‘2i+LIF’ and supertransfected with either an empty vector (EV) or a NANOG-expressing vector (NANOG). (H) Model architecture of the core regulatory network of ES cells.