
Figure 2.
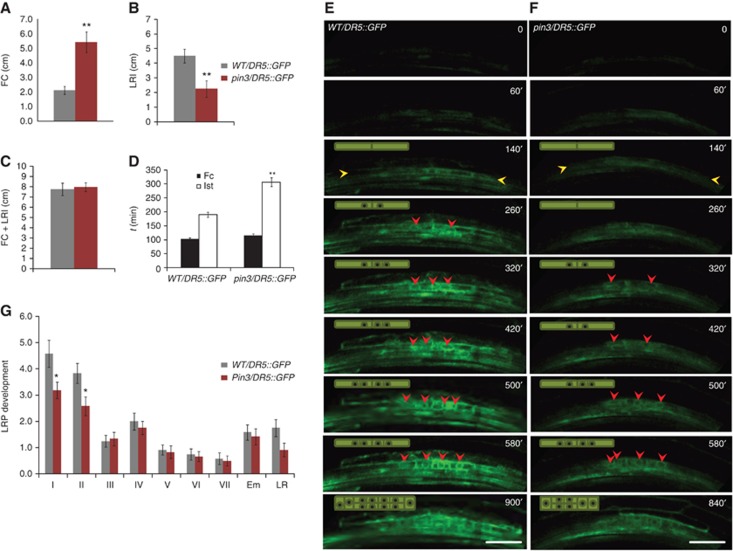
The pin3 mutation causes a delay in the transition from the FC stage to LRI. (A) FC density is increased in pin3 mutants compared to WT. (B, C) LRI density is decreased in pin3 mutants (B), whereas the sum of FC+LRI densities is similar to WT (C). (D) Timing of FC establishment and LRI after root bending indicates a delay between FC establishment and LRI in pin3 mutants compared to WT. (E, F) Real-time analysis of FC establishment and LRI in WT/DR5::GFP (E) and pin3/DR5::GFP (F) after bending. FC establishment was followed by the appearance of the DR5rev::GFP signal in the pericycle (orange arrowhead) and LRI was scored when nuclear (red arrowhead) division could be observed. Schematic representation of the observed cell divisions is shown in the left upper corner. Image series depicted is a representative example from at least 10 observations and time stated is relative to root bending (D–F). Scale bar: 30 μm. (G) Stage distribution of LRP shows a decrease in stage I and stage II LRP in pin3 mutants. Error bars represent standard error (s.e.m.) (n=10–20). P-values are *<0.05, **P<0.01; Student’s t-test.