Figure 3.

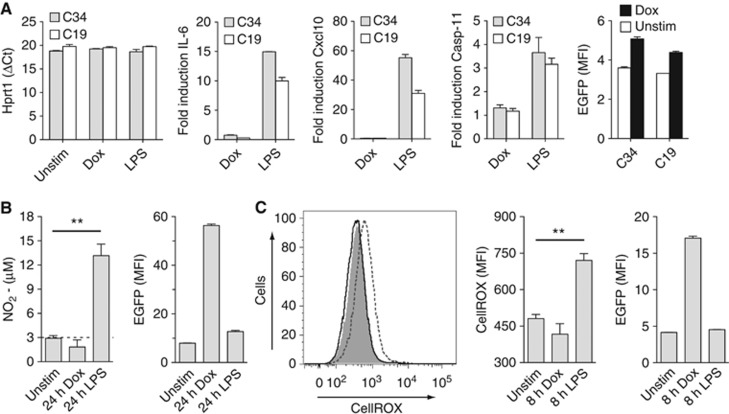
NLRC4/Naip5 agonist expression does not lead to inflammatory cytokine, NO, or ROS production. (A) mRNA and EGFP expression in Dox stimulated (500 ng/ml) or LPS stimulated (100 ng/ml) C34 or C19 cells at 3 h Hprt1 direct transcript values and Hprt1-relative expression data for IL-6, Cxcl10, and Caspse-11. (B) Nitrite levels in culture supernatants of C34 cells 24 h post Dox (500 ng/ml) or LPS (100 ng/ml) addition. (C) ROS levels in living C34 cells 8 h post Dox (500 ng/ml) or LPS (100 ng/ml) addition. First panel: representative histogram of unstimulated (grey fill), LPS-stimulated (dotted line), or Dox-stimulated (solid line) cells. Second panel: quantitative CellROX staining data. Data are mean±s.e.m. of triplicate samples representative of three (A, C) or four (B) independent experiments. Significant differences are indicated **P⩽0.01.
