
Figure 2.
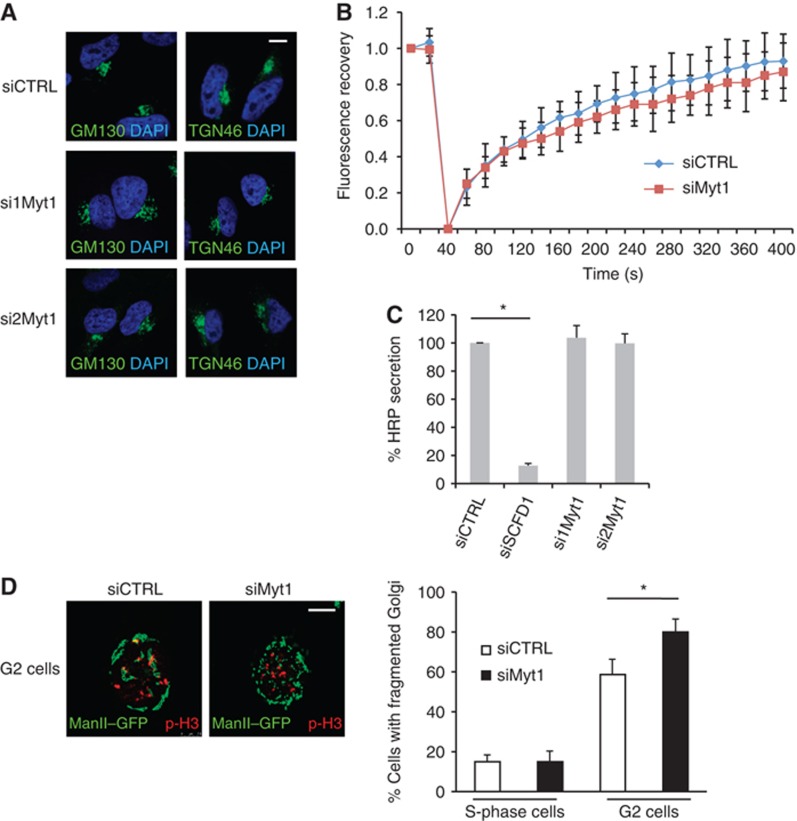
Myt1 knockdown does not modify Golgi organization and function in S-phase but promotes fragmentation of the Golgi complex in late G2. (A) HeLa cells grown on coverslips were transfected with control or Myt1 specific siRNA oligos. 48 h after transfection, cells were fixed and processed for immunofluorescence microscopy with DAPI and antibodies to GM130 and TGN46, respectively. Scale bar is 10 μm. (B) HeLa cells expressing ManII-GFP were transfected with control or Myt1 specific siRNA oligo. 48 h after transfection, the central area of the Golgi complex was bleached and the recovery of fluorescence monitored for 400 s. The fluorescence recovery was quantified as the ratio of GFP fluorescence of the bleached and the unbleached Golgi membrane area and normalized. The rate of recovery in control and Myt1 siRNA transfected cells was plotted and shown (mean±s.d., n=3, >10 cells each). (C) The media from control, SCFD1 and Myt1 knockdown HeLa cells stably expressing ss-HRP were used to detect HRP secretion by chemiluminescence. HRP activity in the medium was normalized to the total HRP activity in the cell lysates (mean±s.d., n=3, *P<0.05). (D) Left panel. Control and Myt1 siRNA transfected HeLa cells stably expressing ManII-GFP were arrested in S-phase with a double thymidine block. Cells were washed to remove thymidine, incubated for 8 h in thymidine free medium, fixed and stained with an anti-phospho-histone H3 antibody and visualized by fluorescence microsopy. The images show cells in G2. Scale bar is 10 μm. Right panel. Percentage of cells with fragmented Golgi in S-phase and G2 in control and in Myt1 knockdown cells. For each condition, 200 cells on 2 different coverslips were counted (mean±s.d., n=3, *P<0.05).