Figure 4.

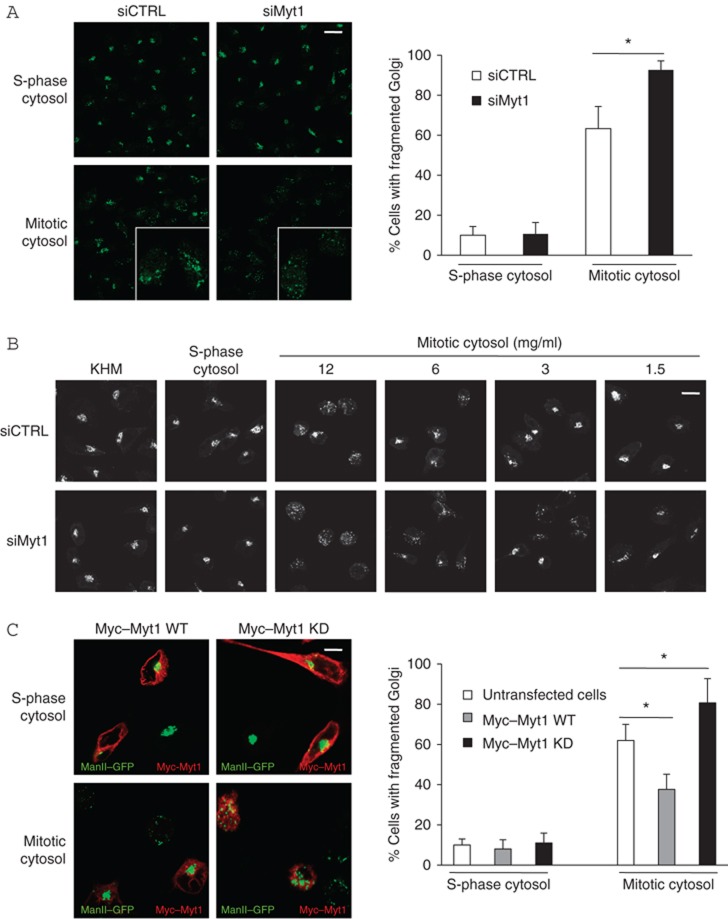
Myt1 inactivation promotes fragmentation of the Golgi complex. (A) Left panel. HeLa cells stably expressing ManII-GFP were transfected with control or Myt1 specific siRNA oligo. After incubation with thymidine for 12 h, cells were permeabilized, salt-washed and incubated with S-phase cytosol (top panel) or mitotic cytosol (bottom panel), and visualized by fluorescence microscopy. Scale bar is 40 μm. Right panel. Percentage of cells with fragmented Golgi upon incubation with S-phase or mitotic cytosol in control and in Myt1 knockdown cells. For each condition, 200 cells on 2 different coverslips were counted (mean±s.d., n=3, *P<0.05). (B) HeLa cells stably expressing ManII-GFP were transfected with control or Myt1 specific siRNA oligo. After incubation with thymidine for 12 h, permeabilized and salt-washed cells were incubated with KHM buffer, S-phase cytosol, or serial dilutions of mitotic cytosol. The organization of Golgi membranes was analysed by fluorescence microscopy. Scale bar is 20 μm. (C) Left panel. HeLa cells stably expressing ManII-GFP were transfected with Myc-Myt1 wild type (WT) plasmid and Myc-Myt1 kinase dead (KD) plasmid. After incubation with thymidine for 12 h, permeabilized and salt-washed cells were incubated with S-phase cytosol (top panel) or with mitotic cytosol (bottom panel) and visualized by fluorescence microscopy. Transfected cells were identified by staining with an anti-Myc antibody. Scale bar is 15 μm. Right panel. Percentage of cells with fragmented Golgi upon incubation with S-phase or mitotic cytosol in untransfected cells, cells expressing Myc-Myt1 WT, or Myc-Myt1 KD. For each condition, 200 cells on 2 different coverslips were counted (mean±s.d., n=3, *P<0.05).
