
FIG. 4.
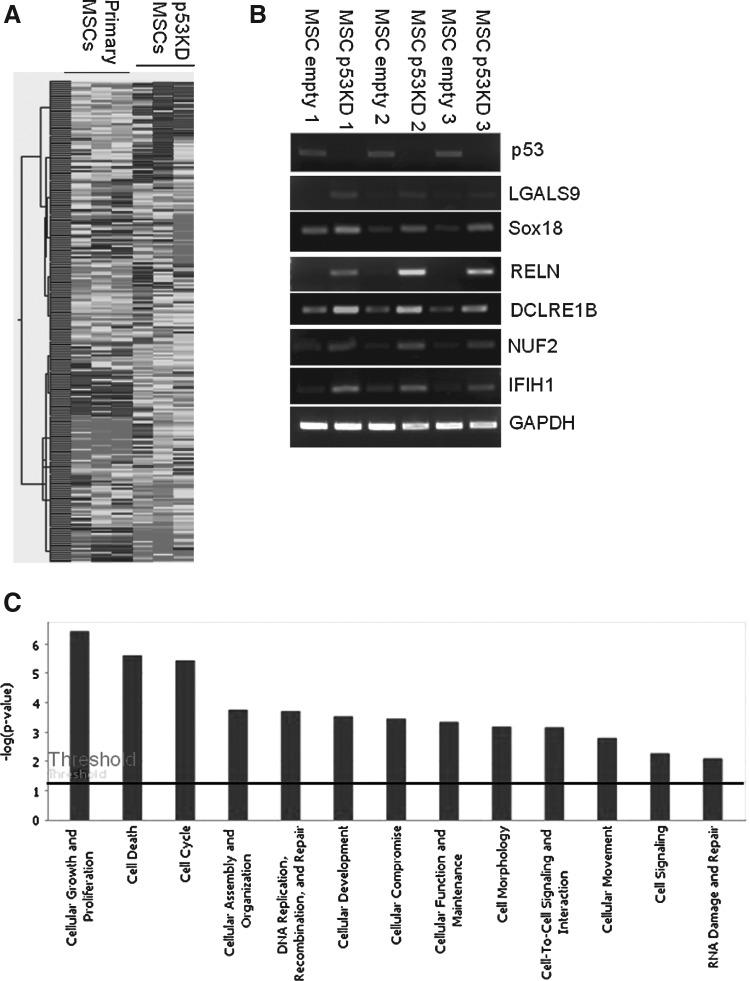
Comparison of gene expression profile between primary and p53 knockdown MSCs. (A) Comparison of gene expression profile between primary MSCs at passage 5 and p53 knockdown MSCs from 3 patients by microarray. (B) Verification of microarray data by reverse transcription (RT)-PCR. (C) Gene Ontology Classification of upregulated genes in p53 knockdown MSCs compared with control MSCs by Ingenuity Pathways Analysis. High-expression gene categories in p53 knockdown MSCs include cellular growth and proliferation, cell cycle and DNA replication, recombination, and repair.