
FIG. 3.
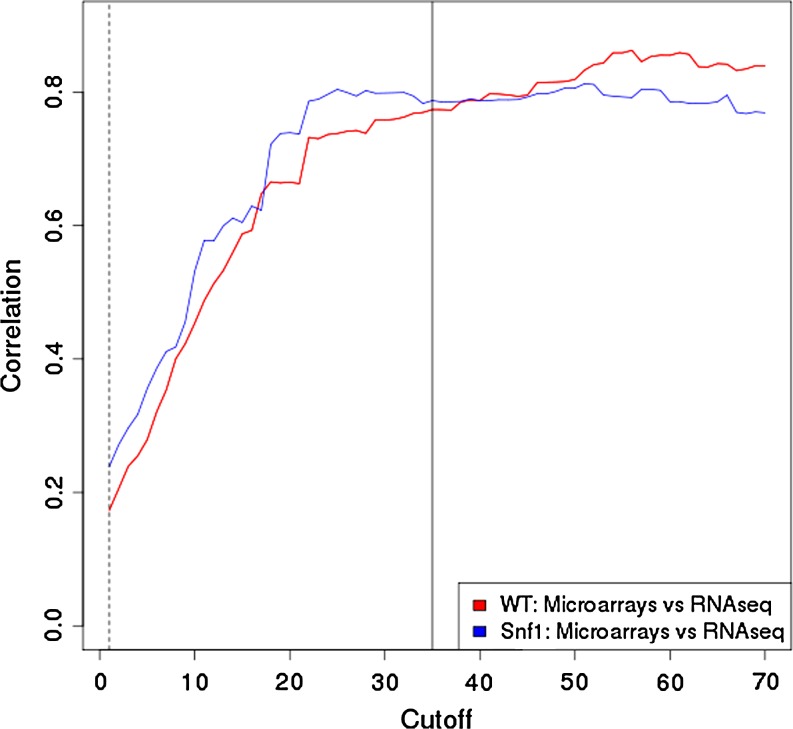
Pearson's correlation coefficient computed between the microarray and the pyrosequencing comparisons as a function of the threshold in normalized number of reads per transcript (RPKM). Red line corresponds to the WT comparison and blue line to the Snf1 comparison.