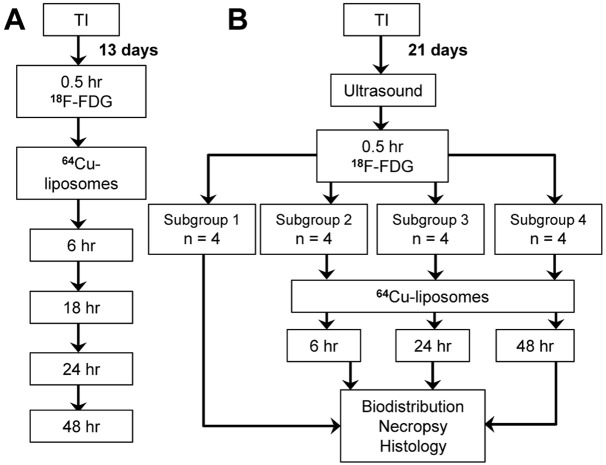
Figure 1.

Study design diagram. A: The first cohort (n = 8 mice) was imaged 13 days after tumor implantation. Images were first acquired with 18F-FDG 0.5 hours after injection. Mice were then injected with 64Cu-liposomes and imaged at 6, 18, 24, and 48 hours after injection. B: The second cohort (n = 16 mice) was imaged 21 days after tumor implantation with ultrasound and then with 18F-FDG at 0.5 hours after injection. Subgroups of 4 mice were then sacrificed at each imaging time point: 0.5 hours after 18F-FDG injection (without PET imaging), 6, 24, and 48 hours after 64Cu-liposome injection (with 18F-FDG and 64Cu-liposome PET imaging). TI = Tumor Implantation.
