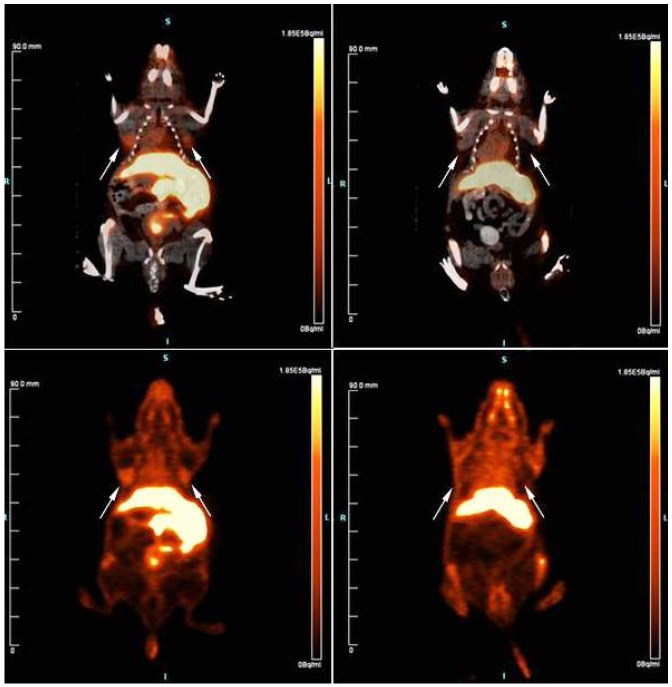
Figure 6.

PET-CT and PET images at 60 minutes: top panels are a combined PET-CT while bottom panels are thepure PET image; unblocked mouse is shown in the left while the blocked mouse (pre-injected with 100 μg BBN(6-14)) is shown on the right; white arrows indicate position of xenograft tumors that have been derived from PC3human prostate adenocarcinoma cells.
