
Figure 3.
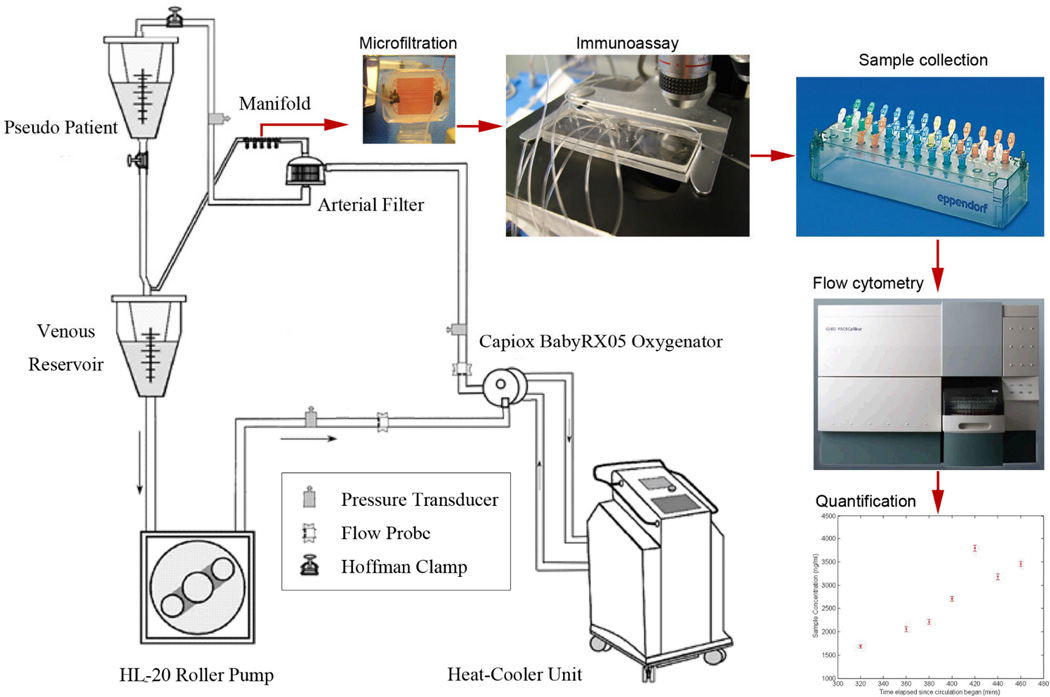
Diagram of the experimental procedure. Blood sampled from the simulated CPB circuit is diverted into the microfiltration device. The filtered plasma is pumped into the immunoassay device along with the microbeads and other reagents. The incubated microbeads are collected in batches. Each microbead sample is fluorescently labeled and quantified using a flow cytometer. Concentration quantification is based on comparison with a calibration curve.