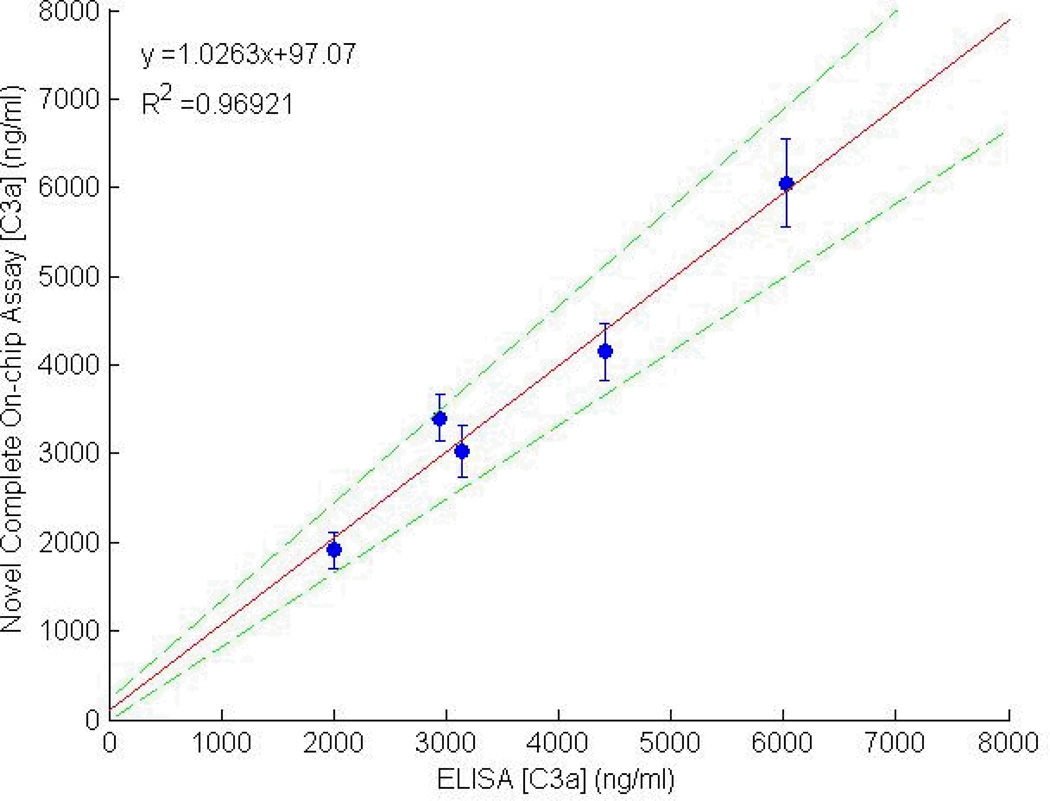
Figure 4.

Pair-wise scatterplot comparing C3a measurements made with the microfluidic assay with those made using a standard ELISA plate. The error bars represent the fluorescence variation within the bead population (n=1000) analyzed in the microdevice. The dashed lines represent the 95% confidence interval of the data set.
