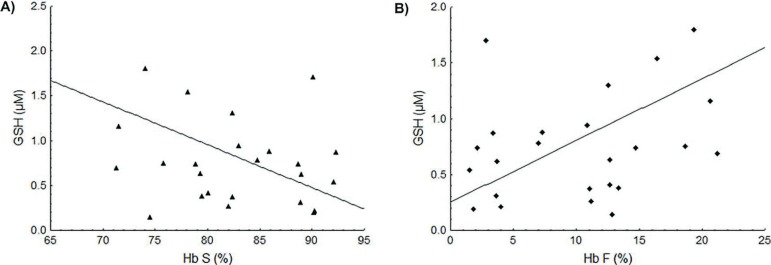
Figure 2.

Association between the Hb S and Hb F concentrations and the GSH levels. (A) Negative linear correlation between Hb S and GSH levels (r = -0.49; p-value = 0.0111). (B) Positive linear correlation between Hb F and GSH levels (r = 0.56; p-value = 0.0031).
