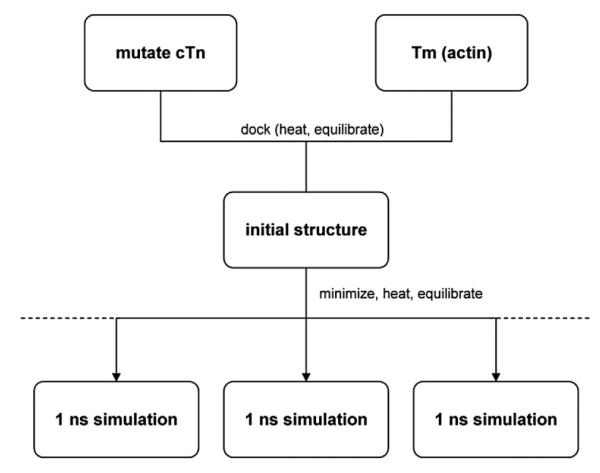
Fig. 10.

Schematic of simulation method. After the initial cTn structure was mutated, the mutant cTn and Tm were gradually docked. The resulting structure was then minimized, heated, and equilibrated. Multiple simulations were run with varying initial conditions (the broken lines representing the potential for additional simulations with varied initial conditions in the future). Each 1-ns production run took approximately 2 weeks.
