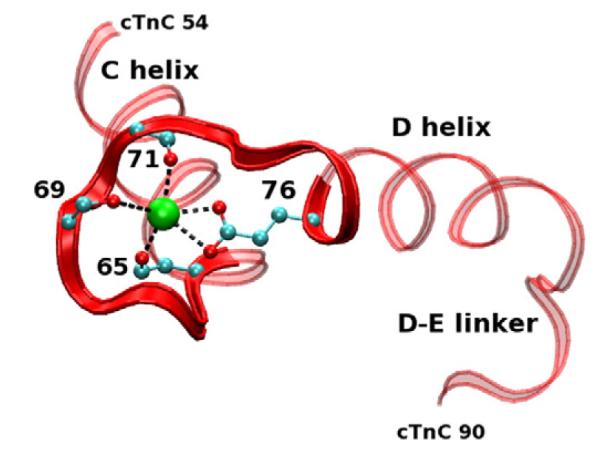
Fig. 11.

Site II cTnC average structure from a WT simulation. Red ribbon, cTnC; green, calcium ion. Portions of the side chains with coordinating oxygens are shown with carbons (cyan spheres) and oxygens (red spheres). Our model is capable of measuring five of the interactions between oxygen and calcium due to our use of implicit solvation.
