
Fig. 3.
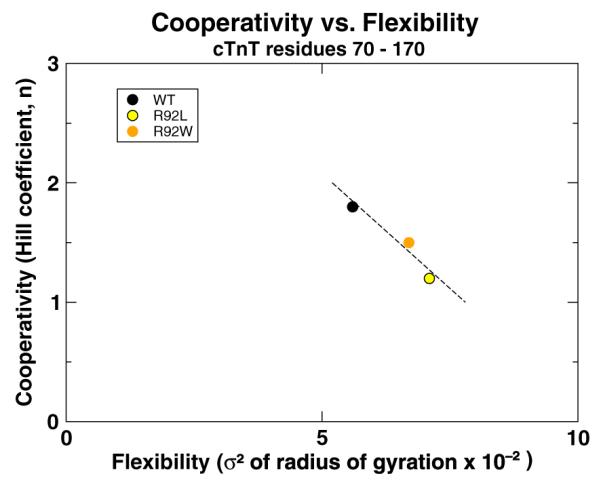
The comparison of cooperativity of calcium activation of the thin filament measured with R-IVM experiments26 and flexibility of TNT1 measured from our simulations shows a correlation between the two properties (r=−0.94). The flexibility of TNT1 was calculated by measuring the variance (σ2) of the rgyr of residues 70–170 of cTnT. The broken line is a best-fit line to highlight the inverse nature of the relationship between flexibility and cooperativity. Data are provided in Supporting Information, “rgyr and R-IVM data”.