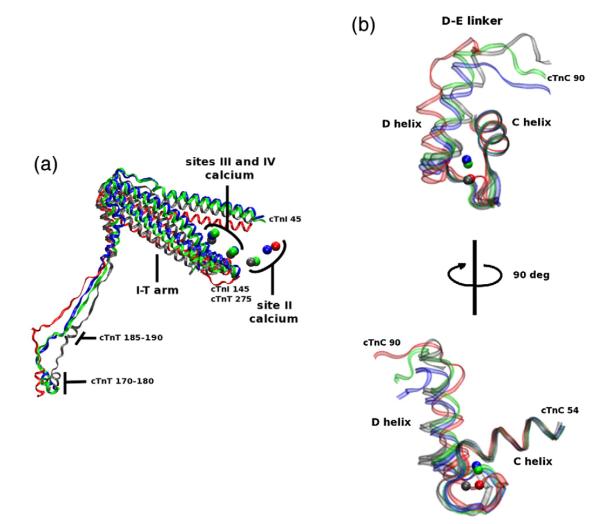
Fig. 8.

a) cTn core of WT (gray), ΔE160 (red), E163K (blue), and E163R (green) aligned with respect to Tm (data not shown). This image is a portion of Fig. 6 rotated and enlarged. The portions shown are cTnT residues 170–288, cTnI 45–135, and the calcium ions. The decrease in secondary structure noticeable in cTnT residues 185–190. The shift in the I-T arm and site II calcium ions are similar for E163K and E163R but different from ΔE160. (b) Site II cTnC of WT (gray), ΔE160 (red), E163K (blue), and E163R (green) aligned with respect to the C helix of cTnC. The backbone is left transparent to better observe the calcium positions, and the top image is rotated 90° to yield the bottom image for better perspective of the entire E-F hand. This image highlights the mutationally induced effects experienced at site II. There is a noticeable perturbation in the dynamics of site II and the average positions of calcium. These changes result in an increase in the distances between coordinating oxygens in site II and calcium for E163K and E163R mutations and a decrease in distance for ΔE160.
