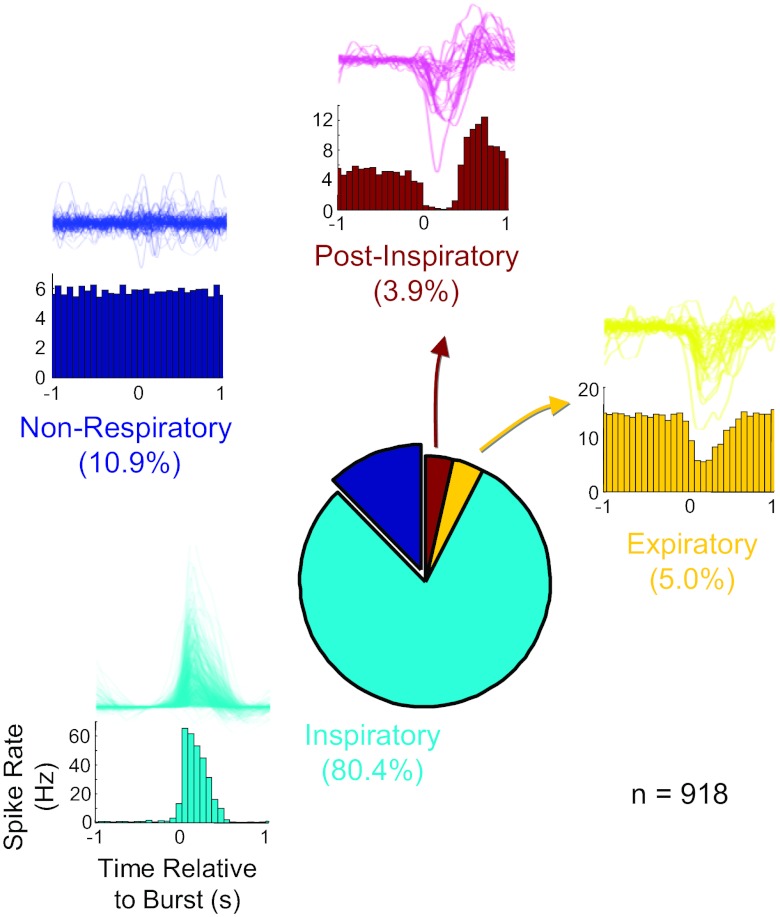
Fig. 2.
Prevalence of 4 traditionally defined firing patterns from 77 in vitro multiunit recording experiments (n = 918 cells). For each cell type, histograms (bottom) illustrate the population burst-triggered firing pattern for example cells in that class, and the population of burst-triggered firing rate functions for each class is shown as a density plot (top).

