
Fig. 3.
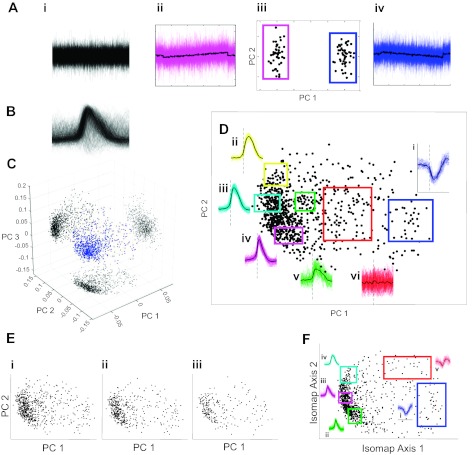
Analysis of cycle-triggered rate functions using dimensionality reduction techniques. A: an illustrative example of PCA applied to synthetic data with 2 subtly distinct waveform classes buried in high-amplitude Gaussian noise. Projection of the original high-dimensional data (i) onto the first 2 PCA dimensions (PC 1 and PC 2) shows distinct clusters (iii) from which the original waveform classes can be perfectly recovered (ii and iv). B: density plot showing all data waveforms demeaned and normalized to unit peak-to-peak amplitude. C: point cloud of waveforms in 3 primary PCA dimensions with shadow projections on axis planes. D: the features captured by the first 2 dimensions of PCA are illustrated with examples from various regions in this space (i–vi). E: additional PCAs of more selective subsets of waveforms (i–iii) show similar weak clustering. F: a globally nonlinear dimensionality reduction algorithm (isomap) identifies a similar feature space to PCA.