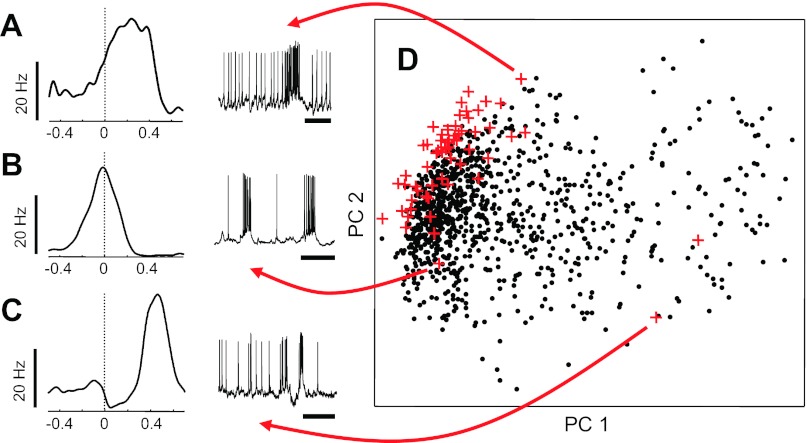
Fig. 4.
Intracellularly recorded burst-triggered firing patterns. A–C: samples of firing rate functions from intracellular recordings (left; sample membrane potential traces, right) are morphologically similar to those estimated from multielectrode extracellular recordings. D: rate functions from 61 intracellular recordings (red crosses) shown along the primary PC axes against the field of points from Fig. 3D.

