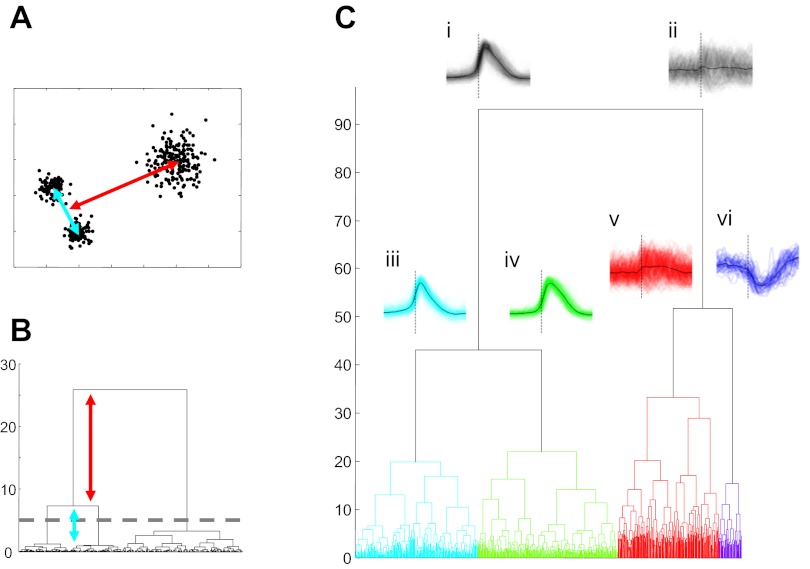
Fig. 5.
Hierarchical cluster analysis applied to cycle-triggered rate functions. A and B: hierarchical groupings in synthetic data (A) can be revealed by a dendrogram (B), which illustrates relationships between groups of data points. C: application of this technique to burst-triggered firing rate functions shows a primary but weak division between inspiratory and noninspiratory waveforms (i and ii) and a secondary bifurcation into sharp (iii) vs. more rounded inspiratory waveforms (iv) and weakly or unmodulated firing patterns (v) vs. clear expiratory cells (vi).

