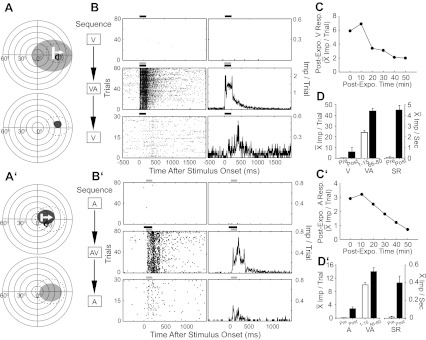
Fig. 4.

Cross-modal exposure activated the previously silent (V, A–D, top; A, A′–D′, bottom) channel in two Covert multisensory neurons. A (top): the A and predicted V (dotted) RFs are shown, and stimuli are illustrated with icons. A (bottom): the actual V RF (black circle) was mapped following cross-modal exposure, which activated the silent V channel. B: rasters (left) and peristimulus time histograms (right) show preexposure V, cross-modal exposure, and postexposure V responses. Bin width = 10 ms. C: the line graph plots the decline in the mean magnitude of the V response at 10-min intervals following cross-modal exposure (Post-Expo). D: the bar graph summarizes the exposure effects by comparing the mean V responses and spontaneous rates (SR) before (Pre, white bar) and immediately after (Post, black bar) exposure. It also reveals response changes taking place during exposure by illustrating the mean cross-modal responses on the first (1–15) and last (66–80) 15 trials. Conventions are the same as in previous figures.
