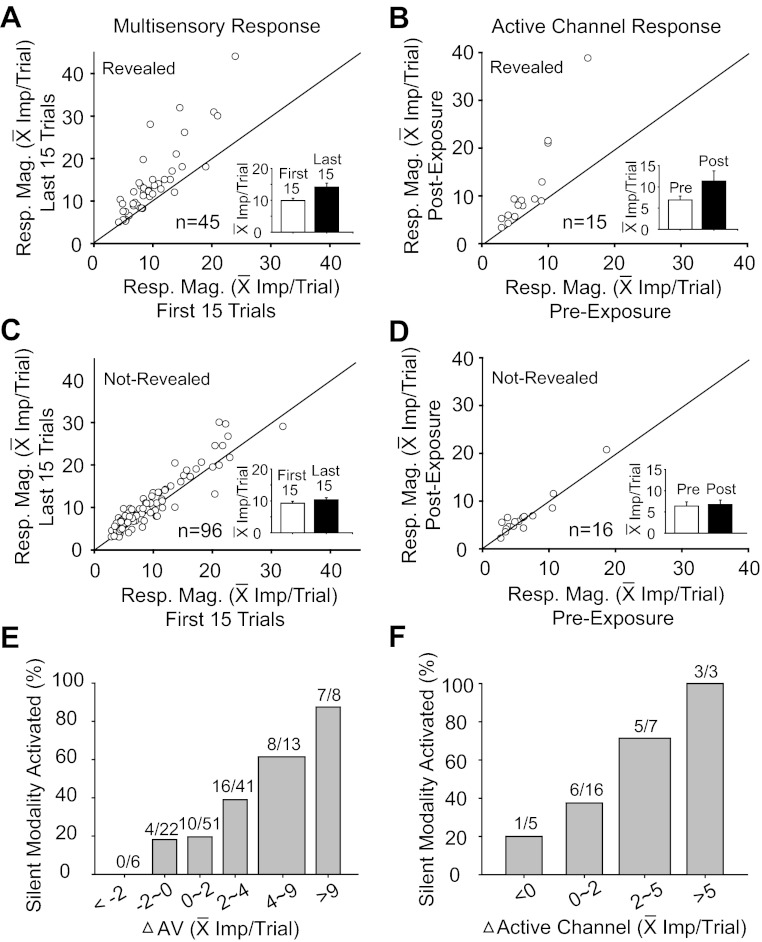
Fig. 7.
Neurons whose silent sensory channel was revealed by cross-modal exposure had more robust response changes than did those whose silent channel was not revealed. A and C: comparisons of the mean multisensory response magnitudes in the first 15 (x-axis) and last 15 (y-axis) exposure trials were plotted for neurons in which the silent-channel was (A), or was not (C), revealed. The inserted bar graph in each panel shows the mean population response magnitude in the first (white bar) and last 15 exposure trials (black bar). B and D: response magnitudes in the channel that was active initially were compared before (x-axis) and after (y-axis) exposure for neurons in which the silent channel was (B), or was not (D), revealed. The corresponding inserted bar graphs summarize comparisons. Note that the greatest response enhancement in the active channel was in neurons whose silent input was revealed. E and F: bar graphs show that the probability of exposure-induced activation of the silent channel increased with increasing enhancement in the multisensory response (i.e., differences between mean responses on the first and last 15 exposure trials), and also with the magnitude of the response change in the initially active channel. Numbers above each bar denote the ratio: no. neurons whose silent modality was revealed/total no. neurons whose response change was within the bin (x-axis).

