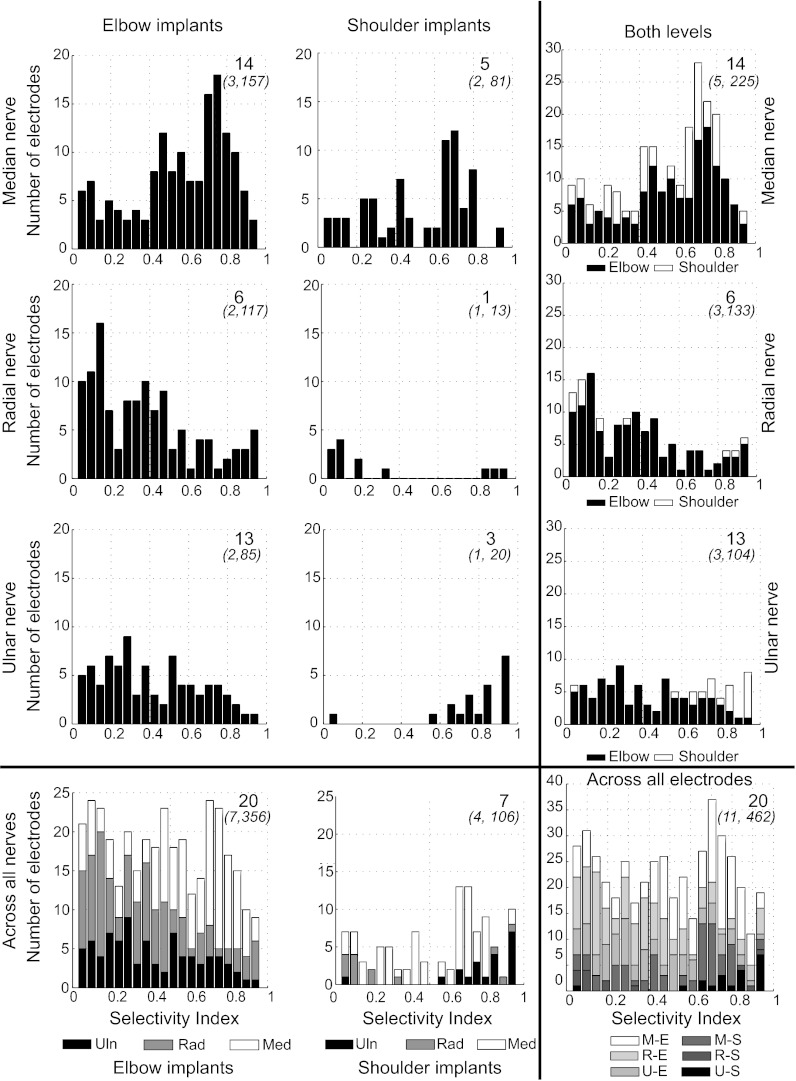
Fig. 3.
Selectivity of muscle activation for all USEA electrodes and implant sites. The number of electrodes that recruited responses at a given level of selectivity is depicted across all levels and nerves. Left: results for USEA implants near the elbow for median nerve (top), radial nerve (2nd row), and ulnar nerve (3rd row) and across all nerves (bottom). Center: results for USEA implants in nerves near the shoulder. Right: results summated for USEAs at both the elbow and the shoulder. Bottom right: group results across all nerves at both levels. For each panel, the large number at top right indicates how many different muscles could be preferentially activated at that particular level-implant combination across all selectivity indexes (SIs). The smaller numbers in parentheses below the number of muscles indicate the number of implants and the number of electrodes used in the analyses, respectively.

